Curated OER
To Drink or not to Drink
Seventh graders discuss water quality, water availability and water resources and how water is used in the world around them. They view a video on water quality then test for pH, temperature and dissolved oxygen to indicate water quality.
Curated OER
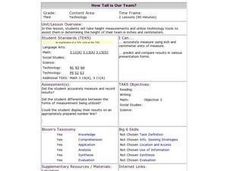
Math/Technology: Height Measurement
Third graders, using technology tools, determine the total height of their classmates in both inches and centimeters. Once the measurements are taken, they enter the results in the Excel file. Once students have prepared a KidPix number...
Curated OER
SC Populations Along Major Interstates
Students examine the population among the interstates in South Carolina. Using the internet, they identify the counties and roads and compare it with their own drawing.
Curated OER
Stock It To Me
Students investigate the stock market using stock market tables, charts, and graphs. They participate in a simulation of stock market investment over time. They read about the history of Wall Street and the Stock Market.
Curated OER
Plants Under Attack
Third graders will identify the four needs for plant survival and gain skills and confidence in using scientific measurement tools, probes as well as the spreadsheets and graphing capacity of a computer to represent and analyze data.They...
Curated OER
2D Kinematics w/ String Racers
Students calculate the speed of string racers. In this physics lesson, students measure the time in several trials and get the average. They graph their results using a spreadsheet.
Curated OER
The Breathtaking Nature of the Urban Explosion, Part 2
Students explore ozone levels. They measure the concentrations of ground-level ozone in the atmosphere. Students observe changes in the concentrations of ozone over time. Students complete a data sheet to record ozone readings over a...
Curated OER
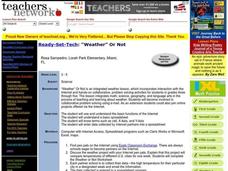
Weather Or Not
Students use the internet to find pen pals to share in their weather experiment. Individually, they research the high and low temperatures for cities within the United States and email the results to their pen pal. They also develop a...
Curated OER
Learning About Graphics
Learners practice using and filling in a spreadsheet. They also create graphs and charts that coorespond with the data. This is a unit comprised of four lesson plans.
Curated OER
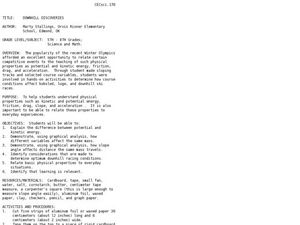
Downhill Discoveries
Young scholars are involved in hands-on activities to determine how course conditions affect bobsled, luge, and downhill ski races.
Curated OER
Texas Weather Report
Students use provided links to observe selected weather sites and collect temperature and precipitation data for listed cities. They enter the information onto their spreadsheet. Students study maps of the Texas natural reagions,...
Curated OER
Life During the Industrial Revolution
Seventh graders present information about the Industrial Revolution. In this Industrial Revolution lesson, 7th graders work in groups research inventions and prepare an information poster for the invention. Students present their poster.
Curated OER
1Word and Letter Match Puzzle
In this word and letter match activity, students match groups of 3 letters to words that contain each set. A reference web site is given for additional activities.
Curated OER
Decomposers at Work!
Students design and conduct investigations that illustrate the process of decomposition. After a lecture/demo, students simulate the process of soil composting in the classroom. They closely chart the decomposition of their soil.
Curated OER
Bioremediation
Students design and conduct investigations that illustrate the effect bioremediation has on organic matter and determine environmental applications. They, in groups, present their findings to the class.
Curated OER
How Do You Get to School?
Third graders talk about all the various ways they get to school. They make a list of all the bus numbers that the students use. They also list all the other methods of transportation used and solidify a hypothesis.
PBL Pathways
Students and Teachers
Predict the future of education through a mathematical analysis. Using a project-based learning strategy, classes examine the pattern of student-to-teacher ratios over a period of years. Provided with the relevant data, learners create a...
Statistics Education Web
NFL Quarterback Salaries
Use statistics to decide if NFL quarterbacks earn their salaries! Learners study correlation coefficients after using technology to calculate regression equations. Through the data, they learn the meaning of correlation and correlation...
Curated OER
Small Business
Students simulate owning and running a small business by playing Lemonade Stands. They play the game for three weeks, then work with a partner to produce a Power Point presentation which would be given to a Board of Directors showing...
Curated OER
BRIDGING THE GENERATION GAP
Students create a hypothesis about the attitudinal differences between generations, test their hypothesis with a survey, chart their findings, and present their answers to the class.
Curated OER
Aerospace Engineering
Twelfth graders examine the physics of rocket flight. They build and launch model rockets to measure their performances.
Curated OER
"Croak" Science Mystery
Solve the mystery of a declining frog population! Lead your junior ecologists on an investigation that simulates actual events concerning pollution, predation, poaching, and more. Investigators read a story online, then analyze survey...
Fort Bend Independent School District
Data Analysis - AP Statistics
What better way to study survey design than to design your own survey! Bring a versatile data analysis project to your AP Statistics class, and encourage them to apply the practices from their instructions to a real-world survey...
Cornell University
Sound Off!
Time to witness the effects of sound. Learners analyze different materials to determine their abilities to absorb sound waves. They use free software to monitor the amplitude of the waves to verify results.

