Other
Laus Dnet: Grade 5 Excel Lesson Plan
In this online instructional activity, young scholars will survey students in their school to determine their favorite type of hand-held ice cream. Before performing the survey, young scholars will make predictions about which ice creams...
TeachEngineering
Teach Engineering: Using Graph Theory to Analyze Drama
Students analyze dramatic works using graph theory. They gather data, record it in Microsoft Excel and use Cytoscape (a free, downloadable application) to generate graphs that visually illustrate the key characters (nodes) and...
TeachEngineering
Teach Engineering: Graphing Your Social Network
Students analyze their social networks using graph theory. They gather data on their own social relationships, either from Facebook interactions or the interactions they have throughout the course of a day, recording it in Microsoft...
Science Education Resource Center at Carleton College
Serc: Exploring Regional Differences in Climate Change
Students create a set of graphs that facilitate comparison of climate change predicted for various states. They also use Microsoft Excel to create a graph showing precipitation data.
Other
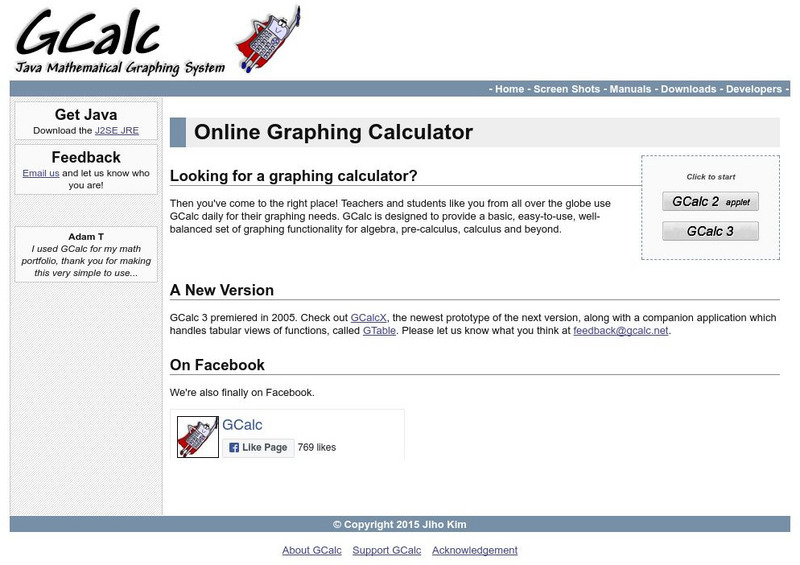
G Calc: Java Online Graphing Calculator
This free online graphics calculator is an excellent resource to aid with studies in algebra, calculus, trigonometry, etc.
TeachEngineering
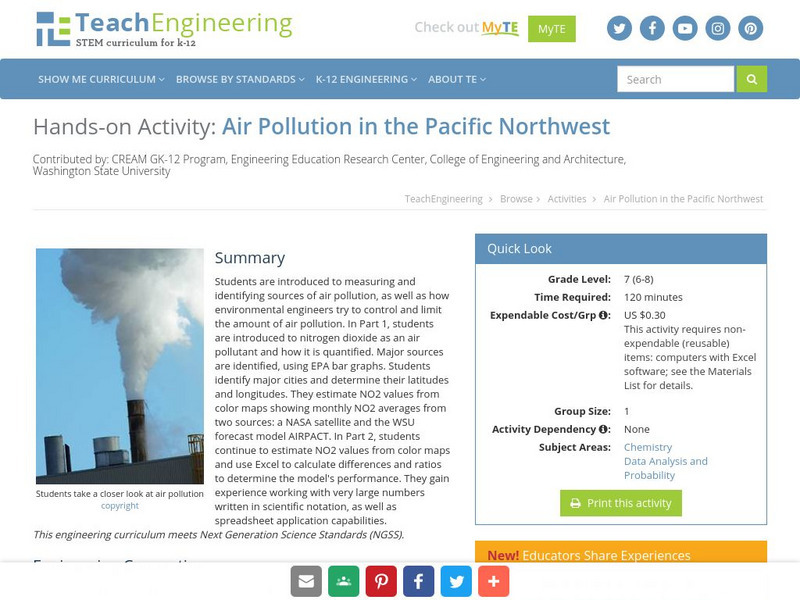
Teach Engineering: Air Pollution in the Pacific Northwest
Students are introduced to measuring and identifying sources of air pollution, as well as how environmental engineers try to control and limit the amount of air pollution. In Part 1, students are introduced to nitrogen dioxide as an air...
ClassFlow
Class Flow: Ice Cream Bar Graph
[Free Registration/Login Required] This flipchart reviews bar graphs, how to create them and read them. Excellent activity to get your students involved in a tasty math activity!
Texas Instruments
Texas Instruments: Math Today the Next Frontier for Flight
This activity provides students the opportunity to gain experience in creating circle graphs on the calculator and provides an excellent real-world review of computation with percents.
Science Education Resource Center at Carleton College
Serc: Cycles of the Sun and Moon
Students download sunrise and sunset data along with moon phase data, and graph these data sets together in a spreadsheet in order to visualize the cycles of the seasons and the moon.
TeachEngineering
Teach Engineering: Applying Hooke's Law to Cancer Detection
Students explore Hooke's law while working in small groups at their lab benches. They collect displacement data for springs with unknown spring constants, k, by adding various masses of known weight. After exploring Hooke's law and...
TeachEngineering
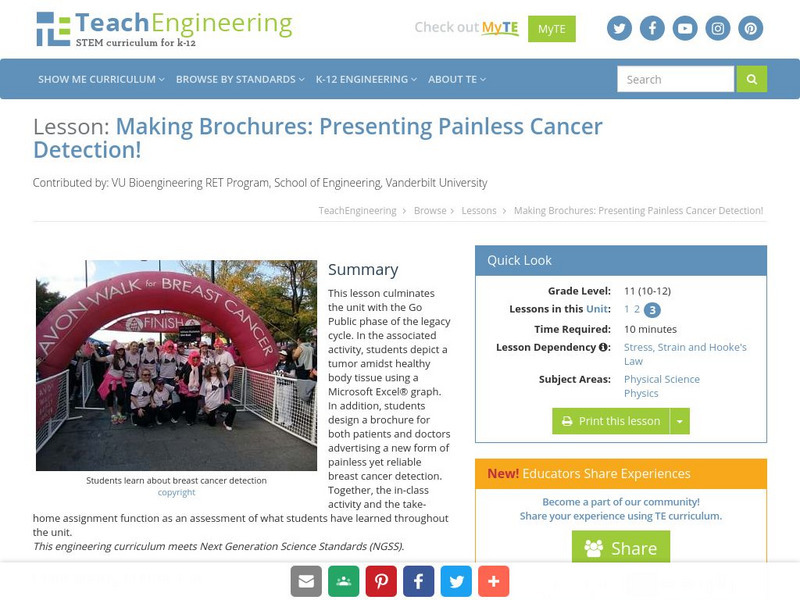
Teach Engineering: Presenting Painless Breast Cancer Detection!
This instructional activity culminates the unit with the Go Public phase of the legacy cycle. In the associated activity, students must depict a tumor amidst healthy body tissue using a graph in Microsoft Excel. In addition, students...
Other
Water on the Web
Water on the Web (WOW) is an advanced site allowing students to actively participate in data analysis from real research sites. Lesson plans on a range of topics are provided. There is also a tutorial for using Excel to graph WOW data.
TeachEngineering
Teach Engineering: Latex Tubing and Hybrid Vehicles
This unit gives students the opportunity to make use of linear models in order to make predictions based on real-world data. Students experience how engineers address incredible and important design challenges through the use of linear...
Science Education Resource Center at Carleton College
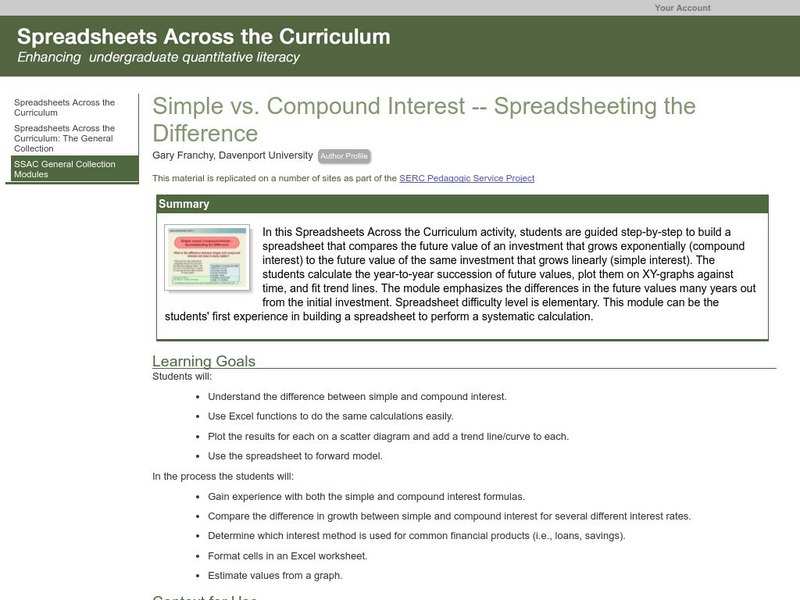
Serc: Simple vs. Compound Interest Spreadsheeting the Difference
A lesson plan that includes a PowerPoint learning module for learners. The goal of the lesson plan is to learn the difference between simple and compound interest and to use the functions in Excel to perform the calculations and graph...
Texas Instruments
Texas Instruments: Math Today Challenge New Color of Money
In this activity, students will read about the changes in the "new money" and then create a graph to represent various combinations of currency produced. This activity provides an excellent example of discrete, real-world data.
Teachnology
Teachnology: Spreadsheet Guide for Teachers
A Spreadsheet is a wonderful tool with applications well beyond simple calculations. This site provides a collection of lesson plans, tutorials and worksheets that help bring spreadsheets into the classroom.
TeachEngineering
Teach Engineering: The Energy Problem
This six-day lesson provides students with an introduction to the importance of energy in their lives and the need to consider how and why we consume the energy we do. The lesson includes activities to engage students in general energy...
TeachEngineering
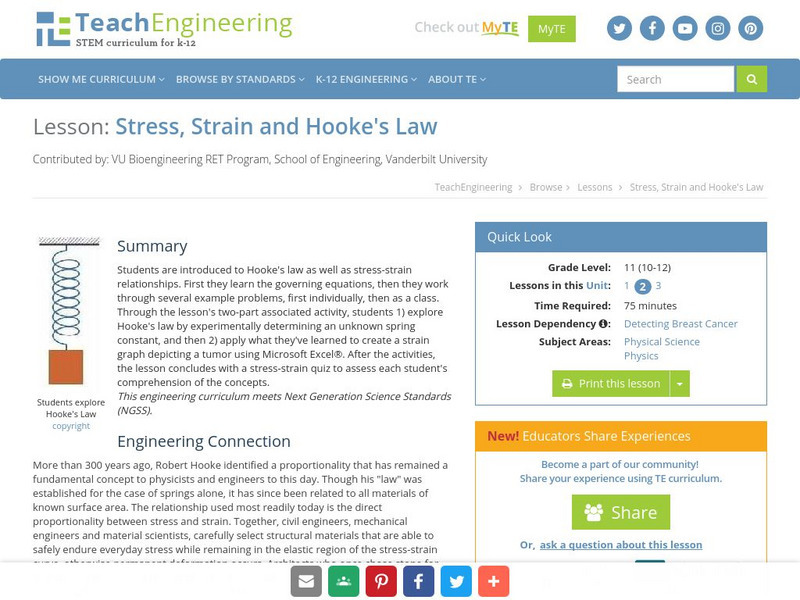
Teach Engineering: Stress, Strain and Hooke's Law
This lesson offers an introduction to Hooke's Law as well as stress-strain relationships. Students will first learn the governing equations. Then students will work through several example problems first individually, then as a class. In...
Texas Instruments
Texas Instruments: Stretching Slinkies
This lesson provides students with the opportunity to explore the TI-84 graphing calculator in conjunction with Microsoft Excel. Students can use the "Stretching Slinkies" worksheet to record and enter data. They will either: enter data...
Texas Instruments
Texas Instruments: Piecewise Functions on Ti Interactive
Despite what most of us veiw as an excellent TI InterActive! Help file, my students have a difficult time getting the appropriate graphs after reading it. This is visual directions on how to enter piecewise functions in TI InterActive!...
University of Oregon
Magnet Lab: University of Oregon Virtual Laboratory
The collection of interactive physics applets offered by the University of Oregon is an excellent resource for students. The applets are grouped in broad subject areas including astrophysics, energy and environment, mechanics and...


