Curated OER
More with Graphing and Intercepts
In this math worksheet, students graph the equations through recognizing the position of the intercepts. They also create a function table for each.
Curated OER
Rational Functions
In this algebra worksheet, students solve rational functions and identify the x and y intercepts, the vertical and horizontal asymptotes. There are 26 questions.
Curated OER
Linear Functions
Students solve and graph linear equations. In this algebra lesson, students collect data and plot it to create a linear function. They identify the domain and range of each line.
Curated OER
Graphing Linear Equations
In this math worksheet, students practice graphing the linear equations on the Cartesian plane. They also create a function table for each.
Curated OER
Linear Functions, Restricted Domains, Infinite Geometric Series, Interconnections
In this math worksheet, students graph the linear functions in comparison to the inequalities. Then they compare the line segments on the coordinate plane.
Curated OER
Introduction to functions
In this functions worksheet, students plot points on a graph according to the rule. Students plot 7 points on each of the 2 graphs given to them.
Curated OER
Iterating Linear Functions
Students use a spreadsheet to investigate data. In this algebra lesson, students collect and graph data on a coordinate plane. They explain properties of a linear equation both algebraically and orally.
Curated OER
Iterating the Function and Complex Numbers
Students identify the end behavior of polynomial graphs. In this algebra lesson, students factor and solve quadratic and complex equations. They factor out negative roots and identify the real and imaginary parts of an equation.
Curated OER
Linear Functions
Students solve, identify and define linear equations. For this algebra lesson, students calculate the slope and y-intercept of a line. They graph the line given two points and the slope.
Curated OER
Every Graph Tells A Story
Seventh graders explore linear equations. In this graphing activity, 7th graders explore constant rates of change. Students discover the real-life application of graphs and demonstrate their ability to read graphs and write...
Curated OER
Types of Functions
Students graph step functions (for example, the greatest integer function), and then form the inverse function of given function. They also graph piece-wise defined functions and explain step-by-step the process. Finally, students define...
Curated OER
Math 155: Worksheet 12. Functions & Intervals
In this function worksheet, students identify all numbers in the interval. They determine open intervals, find the local maximum and local minimum. This two-page worksheet contains eight problems.
Curated OER
Worksheet 7.4 Function Composition
In this function composition worksheet, students find the composition of functions and state the domain. They graph relations and state the inverse. This two-page worksheet contains twelve multi-step problems.
Curated OER
Quadratic Function Graph
Learnerss engage in a study of quadratic functions and how the coefficient of x^2 has on the graph of it. They study the quadratic function for review with the help of index cards. The lesson plan includes a resource link to align the it...
Curated OER
Teen Pregnancy: Investigating Cubic Functions
In this teen pregnancy learning exercise, students use a scatter plot and cubic functions to solve word problems about teen pregnancy. Students complete 7 problems.
Curated OER
Functions and Logarithms
For this function and logarithm worksheet, students use functions and logarithms to find the sum of digits in a given series. They determine the value of an expression and find the distance between the points of intersection. This...
Curated OER
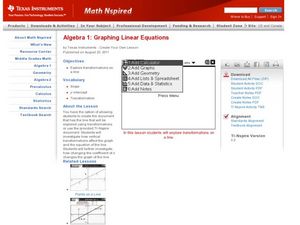
Graphing Linear Equations
Students graph linear equations. In this algebra lesson plan, students perform transformation on linear equations. They identify the slope and y-intercept of each line.
Curated OER
Trigonometric Functions
In this trigonometric functions worksheet, students solve and complete 4 different types of problems. First, they decide whether the given equation defines y to be a function of x and find the domain. Then, students graph each function...
Curated OER
Find the Average Value of a Function
In this calculus worksheet, 11th graders calculate the average value of a function. They find the line tangent to a curve and graph the equation. There are 15 questions.
Curated OER
Graphing Linear Equations
Eighth graders examine linear equations by creating graphs from them. In this graphing lesson, 8th graders read several linear equations and plot them on a graph with the help of their classmates. Students find the slope of...
Curated OER
Additional Practice Problems with Skills for Quadratic Functions and Equations
Challenge your students' graphing and factoring skills with these sets of problems for quadratic functions and equations. Here, kids plot the y-intercept and vertex of 7 parabolas. They factor and solve 9 quadratic equations. Students...
Curated OER
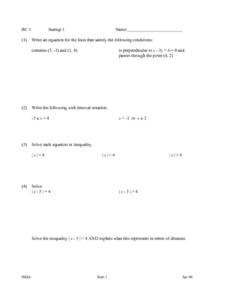
Startup 1: Functions & Interval Notation
In this function worksheet, students write an equation of a line. They solve inequalities and write functions with interval notation. This two-page worksheet contains approximately 20 problems.
Curated OER
More Complicated Functions: Introduction to Linear Functions
Students explore the concept of linear functions. For this linear functions lesson, students translate linear functions from tables to graphs to equations. Students use an applet to write a function rule for a linear function in...
Curated OER
Composition of Functions
Students solve composition of functions. In this algebra lesson, students find the sum, difference and product of functions. They find the inverse of a function.
Other popular searches
- Algebra Graphing Functions
- Exploring Graphing Functions
- Graphing Nonlinear Equations
- Functions and Graphing


