Curated OER
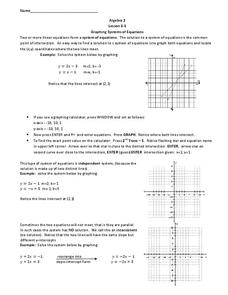
Graphing Systems of Equations
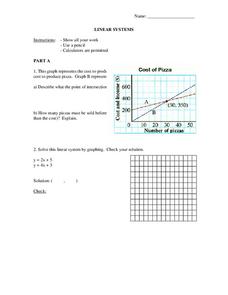
In this Algebra II worksheet, 11th graders use graphing to determine the solution to a system of linear equations. The two page worksheet contains explanation and three guided problems. Answers are not included.
Curated OER
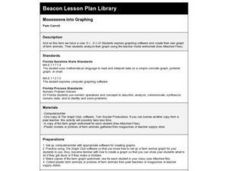
Moooooove into Graphing
First graders explore graphing software and create their own graph of farm animals. Then students analyze their graph using the teacher made worksheet which is imbedded in this lesson plan. Great lesson!
Curated OER
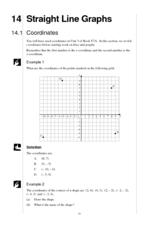
Straight Graph Lines: Coordinates
Students access prior knowledge of coordinates. For this coordinates lesson, students graph coordinate points to create a symmetrical figure and of a straight line. Students complete several practice examples.
Curated OER
Graphing Linear Equations on the TI
Learners graph linear equations on the TI calculator. In this algebra lesson, students rewrite equations in the slope intercept form and use the calculator to graph their problem. They work together to interpret the graphs off of the TI.
Curated OER
Graphing Data from the Chemistry Laboratory
Young scholars graph and analyze data using a spreadsheet.
Curated OER
C is for Cookie-A MEAN-ingful Graphing Activity
Third graders, in groups, dissect a variety of brands of chocolate chip cookies and calculate the mean for each brand. They create their own bar graphs, pictographs, and line graphs to represent information.
Curated OER
Graphing Linear Equations
In this linear equations worksheet, students graph 2 linear equations using x- and y- intercepts. Students then graph 2 additional equations using the slope and y-intercept method.
Curated OER
Systems of linear inequalities in standard form
Learners practice graphing linear inequalities and explain their solution sets to the solving of a system of linear equalities graphically and symbolically. They utilize programming techniques in setting up and solving systems of linear...
Curated OER
Graphing Trigonometric Functions
The student should be able to transfer his knowledge of graphing functions to graphing trigonometric functions. Student should be able to graph trigonometric functions, find amplitude, period, and frequency.
Curated OER
Rational Functions and Their Graphs
In this Algebra II worksheet, 11th graders examine the graphs of rational functions, identifying the points of discontinuity and the vertical and horizontal asymptotes. The three page worksheet contains explanation of topic,...
Curated OER
Generating Points and Graphing
Students create a table of values to help them plot. For this algebra lesson, students plot their points on a coordinate plane creating a graph. They observe and analyze linear functions.
Curated OER
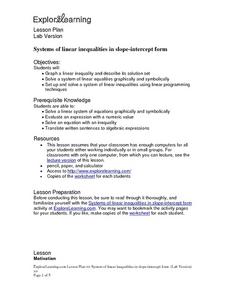
Systems of linear inequalities in slope-intercept form
Students graph a linear inequality and describe its solution set. They solve a system of linear equalities graphically and symbolically. Students set up and solve a system of linear inequalities using linear programming techniques. ...
Curated OER
Four Graphs of Transformations Problems
In this transformations worksheet, students sketch transformations of given graphs in four problems. In one of these problems students match graphs to equations.
Curated OER
Graphing Linear Equations
In this math activity, students practice solving systems of linear equations using the elimination and substitution methods. They also graph the solutions.
Curated OER
Straight Line Graphs
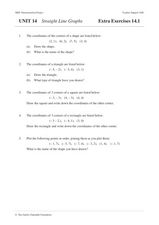
In this math worksheet, students plot lines on a graph paper when given the equation for the line in slope-intercept form. They tell the values of the slope and the y-intercept. Students find the x and y intercepts and plot three lines....
Curated OER
Extra Practice 11.1: Parabolas
In this parabolas worksheet, high schoolers solve 28 short answer problems. Students find the focus, directrix, axis, and equations of parabolas. High schoolers match the equation of a parabola with it's correct graph.
Curated OER
Complex Analysis: Polar & Exponential Forms
In this polar and exponential form worksheet, students use Euler's Formula to write complex numbers in exponential form. They write numbers in rectangular form. This two-page worksheet contains seven multi-step problems.
Curated OER
Minimum and Maximum of a Graph
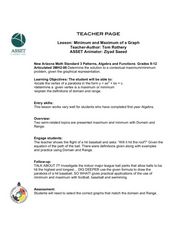
Students find the solutions of polynomials through graphing. In this algebra lesson, students identify the maximum and minimum of each polynomial function. They ind the vertex, domain and range of a parabola.
Curated OER
Simplifying Expressions
In this simplifying expressions worksheet, students solve and complete 41 various types of problems. First, they simplify each expression and write using exponents. Then, students graph each function and state the domain and range. They...
Curated OER
Computer Graphing
Students research the Internet or create surveys to find graphable data. They collect, organize, analyze and interpret the data. Finally, they choose the appropriate type of graph to display the data and find the measures of central...
Curated OER
Find the Slope-intercept Equation Given a Pair of Points
In this graphing worksheet, student find the slope-intercept equation for six given pairs of points. Solutions are provided on the last page.
Curated OER
Worksheet 6, Graphing Functions
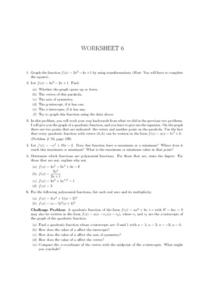
For this algebra worksheet students graph a given function by completing the square. They analyze a function and tell the axis of symmetry, the intercepts, and vertex. Students identify the maximum or minimum of a graph. Students...
Curated OER
Rational Function Graphs
Learners use algebraic methods to represent and solve problems. Using a graphing calculator, students solve rational and inequality problems. They visually demonstrate solutions of functions through graphing. Learners answer questions...
Curated OER
Creating a Bar Graph with a Graphing Program
Learners use the S'COOL data base to create a bar graph.
