CK-12 Foundation
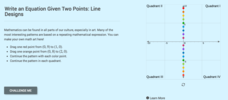
Graphs of Linear Functions: Line Designs
Designs from lines are sublime. Scholars create colorful designs by connecting points on an interactive coordinate plane. They answer questions about slope and quadrants based on their designs.
Curated OER
Does Music Cam the Savage Beast?
Students collect, graph and analyze data. In this statistics lesson, students measure the heart beat of a person as they listen to music. They use the CBL and TI to create a graph, analyzing the outcome.
Curated OER
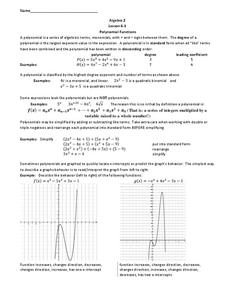
Polynomial Functions
In this Algebra II worksheet, 11th graders classify polynomials by degree, write in standard form, and describe the behavior of the graph. The two page worksheet provides explanation and examples along with thirteen practice...
Curated OER
What's the Weather?
Second graders make daily weather observations, record them with appropriate stickers on a chart, and then summarize them at the end of the week in the form of a bar graph.
Curated OER
Money Circulation: A Story of Trade and Commerce
Students are introduced to the meaning, symbolism, and value of the quarter. They determine the percentage of total monetary value held in quarters and graph the results. Students infer about the U.S. Mint's distrubution of coins. They...
Curated OER
Dealing With Data
Students collect, organize, and display data using a bar graph, line graph, pie graph, or picture graph. They write a summary describing the data represented and compare the graph to another graph in the class.
Curated OER
Bar and Histograms (What Would You Use: Part 1)
Students practice creating bar graphs using a given set of data. Using the same data, they create a group frequency chart and histograms. They must decide the best graph for the given set of data. They share their graphs with the...
Curated OER
Line & Scatter (What Would You Use: Part 2)
Young scholars discuss line graphs and scatter plots and the best situations in which to use them. Using the graphs, they determine the type of correlation between variables on a scatterplot. They create a scatterplot and line graph...
Curated OER
Slopes of Lines
In this slopes of lines instructional activity, 10th graders solve and graph 10 different problems. First, they determine the slope of each line named in the figure and any line parallel to line b and perpendicular to line d. Then,...
Curated OER
Graphing Made Easy
Fourth graders discover the appropriate way to construct and analyze bar, line, picto, and circle graphs. They set up frequency tables and perform some statistical analysis (mean, median, and mode) on their data.
Curated OER
Zoo Favorites
First graders construct a class picture graph and tally grid that show their favorite zoo animals. They discuss the information the graphs show and complete a personal graph based on the class example.
Curated OER
Technology Literacy Challenge Grant Learning Unit
First graders explore counting and classification. They sort leaves, create graphs, write sentences for the data in the graphs, develop graphs for shapes, favorite animals, birthdays, and participate in a die prediction game.
Curated OER
What Days Are the Busiest in the Maternity Ward?
Young scholars form a conclusion using statistical data. In this statistical data lesson, students collect and analysis data to form a conclusion about what day of the week most babies are born.
Curated OER
Heart to Heart
Students predict the outcome of a question and conduct a survey and record their findings on a bar graph.
Curated OER
Functions
Students explore a variety of functions. They recognize and describe functions and use linear functions to describe situations. Students find the domain and range of linear functions and graph rational expressions.
Curated OER
Parabolas
In this parabolas worksheet, 10th graders solve and graph 10 different problems that include various types of parabolas. First, they determine the vertex and the y-intercept for each problem given the information. Then, students write...
Curated OER
A Thanksgiving Survey
Students conduct a survey. In this math lesson, students design and conduct a survey about Thanksgiving foods. Students display the collected data in a graph and use the graph to determine what food to serve for a Thanksgiving meal.
Curated OER
What Are We Listening To?
Students gather data from a web site on number of music albums sold by genre for the last two years. They convert these figures to fractions, decimals, and percents, and display the results in bar graphs and pie charts.
Curated OER
Pets: Stuffed Animal Day
Students bring in their favorite stuffed animals to class, and listen to the book, The Perfect Pet. They develop graphs for their stuffed animals, and create booklets titled, My Pet Book.
Curated OER
A Thanksgiving Survey
Students take a survey then use the information gained from the survey to help plan a typical Thanksgiving dinner for our last day of class. They create a graph which corresponds the the data gathered during interviews.
Curated OER
Chapter 11 - Objective 6.1 Parabola
For this parabolic exercise, students find the vertex and axis of symmetry of parabolas, hyperbolas, and ellipses. They sketch the graph. This one-page worksheet contains ten problems.
Curated OER
Gingerbread Man Math
Students collect and explore gingerbread man data. For this math and technology lesson plan, students examine how to organize and interpret data in three formats: objects, pictures, and graphs.
Curated OER
Impact!!
Learners perform a science experiment. In this algebra instructional activity, students collect data from their experiment and create a graph. They analyze the graph and draw conclusion.
Curated OER
Population Patterns
Students study patterns of population growth in an ecosystem and why populations must remain in balance. They interpret basic population graphs and suggest scenarios about different population growth patterns in an ecosystem.
