Curated OER
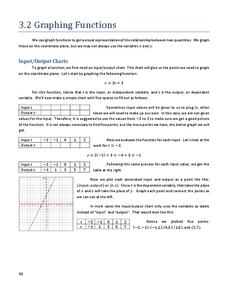
Graphing Functions
For this graphing functions worksheet, students write functions in logarithmic and exponential forms. They evaluate logarithms and determine the inverse of a function. Students graph functions. This six-page worksheet...
Curated OER
Graphing Surveys and Analyzing Data
Young scholars analyze data and graph the results of their surveys. In this statistics lesson, students create graphs using excel to make graphs to be able to better observe their data. They conclude how great we as unique individuals.
Curated OER
Graphing Calculator Activity
In this graphing calculator worksheet, students explore the steps to analyze a complex fraction using a graphing calculator. They simplify a complex fraction to a proper fraction. This four page worksheet contains detailed instructions...
Curated OER
Evaluating Functions
For this evaluating functions worksheet, 11th graders solve and complete 24 various types of problems. First, they evaluate the functions for the given values. Then, students graph each of piecewise functions. They also write an equation...
Curated OER
Forms of Equations
Ninth graders discuss the different forms of equations. In this algebra lesson, 9th graders talk about the pros and cons of algebraic equations. They discuss reflection across the x and y axis and write out the equation of the given...
Curated OER
Pictures, Graphs and Diagrams
In this algebra worksheet, students define vocabulary related to circles, and other conics. They graph hyperbolas and eclipse. There are 20 questions.
Curated OER
Graph It!
First graders use organized data to construct real object graphs, picture graphs, and bar-type graphs.
Curated OER
Writing and Graphing Linear Equations on a Flat Surface
In this linear equations worksheet, students write the equation of a line with given characteristics. They identify the slope of a line and the y-intercept. Explanations and examples are provided at the beginning of the worksheet. This...
Curated OER
Graph a Panther's Diet
Students examine the diet of panthers. In this interpreting data lesson plan, students collect data on the panther's diet and chart the data in bar and pie graphs.
Curated OER
Graph Functions: Practice
In this graph functions instructional activity, students complete several activities to help them graph functions. Students use the table and the graph to complete the questions. Students also answer two test prep questions.
Curated OER
Graphing Pockets
Second graders explore graphing. They count the number of pockets on their clothes and use Microsoft Excel to enter their data. Students create a class graph displaying their findings.
Curated OER
Graphing Linear Inequalities
In this graphing linear inequalities activity, high schoolers graph 1 linear inequality. Students walk through each step to graphing the inequality and shading the appropriate region on the graph.
Curated OER
Graphing and the Coordinate Plane
Students examine the four quadrants of Cartesian coordinate plane. They play maze games and coordinate games to discover how to read and plot points on the plane. Students plot points on the coordinate plane and examine the ratio of...
Curated OER
Limits and the Indeterminate Forms
In this limits worksheet, students use L'Hospital's Rule to solve two short answer problems. They solve fourteen short answer limits problems.
Curated OER
Graph a Situation Without a Table
Students graph an equation without a table. In this algebra lesson, students are given rate or time and asked to graph a line at the starting rate. They use the slope intercept form to decipher the word problem and graph the line.
Curated OER
Graphing Predator/Prey Data
Students use data from the Camouflage Game (played with red and green yarn caterpillars) to create a composite bar graph to display the collected data. They interpret the data and form a conclusion based on the graphs. Teachers may use...
Curated OER
Reteaching graphing linear equations
Students graph linear equations. In this algebra lesson, students draw out comic strips to represent the steps when solving linear equations. They rewrite the equation in the slope intercept form and use the slope and intercept to graph...
EngageNY
Polynomial, Rational, and Radical Relationships
This assessment pair goes way beyond simple graphing, factoring and solving polynomial equations, really forcing learners to investigate the math ideas behind the calculations. Short and to-the-point questions build on one another,...
Curated OER
Exponential Functions
Your algebra learners analyze and interpret the general form and the graph of two functions. The increase of the function due to the multiplicative factor is emphasized.
Inside Mathematics
Population
Population density, it is not all that it is plotted to be. Pupils analyze a scatter plot of population versus area for some of the states in the US. The class members respond to eight questions about the graph, specific points and...
Illustrative Mathematics
Chicken and Steak, Variation 2
Many organizations put on barbecues in order to make money. In a real-world math problem, the money allotted to purchase steak and chicken at this barbecue is only one hundred dollars. It is up to your potential chefs to figure out how...
EngageNY
Solving Exponential Equations
Use the resource to teach methods for solving exponential equations. Scholars solve exponential equations using logarithms in the twenty-fifth installment of a 35-part module. Equations of the form ab^(ct) = d and f(x) = g(x) are...
Concord Consortium
Maintain Your Composition
Compose yourself! Learners first use given graphs of functions f and g to graph the composition function f(g(x)) and identify its value for a specific input. They then consider functions for which f(g(x)) = g(f(x)).
University of Texas
A Library of Parent Functions
Don't think this lesson is for Mom and Dad; parent functions are all for your high schoolers. Flip through a presentation with a focus slide on each type of graph and its characteristics. Some examples are included but the...


