Penguin Books
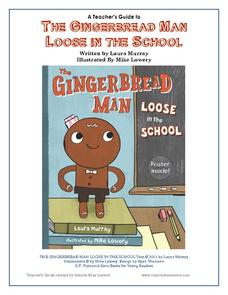
A Teacher's Guide to The Gingerbread Man Loose in the School
What if the Gingerbread Man was trying to catch you, rather than the other way around? Pupils can find out what happens by reading the story The Gingerbread Man Loose in the School by Laura Murray and enrich their experience with the...
Curated OER
Blast the Fats
Students examine the fats found in foods. In this nutrition lesson, students identify the types and amounts of fats found in foods as they research food labels and the Internet. Students classify the fats and record their data.
Curated OER
All About Me
Students use a digital camera to take pictures of various faces. They then sort pictures according to eye color and create a graph. Students draw pictures of themselves on the screen using specified tools and colors. They choose hair...
Curated OER
Thanksgiving Dinner
Students plan a traditional Thanksgiving dinner. In this Thanksgiving lesson, students compare and contrast the first Thanksgiving to Thanksgiving celebrations today. Students plan a traditional Thanksgiving dinner and research the costs...
Curated OER
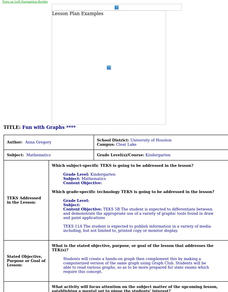
Fun With Graphs
Students create a hands-on graph then complement this by making a computerized version of the same graph using Graph Club. They read various graphs, so as to be more prepared for state exams which require this concept.
Curated OER
Data Collection - Primary Poster
Students explore the concept of collecting, analyzing, and graphing data. In this collecting, analyzing, and graphing data lesson, students create a survey about a topic of interest. Students poll their classmates, analyze, and graph...
Curated OER
Skittles, Taste the Rainbow
Fifth graders learn and then demonstrate their knowledge of a bar and a circle graph using the classroom data. Students are given a pack of skittles candy. Students create a bar and circle graph indicating the results of the contents of...
Curated OER
Healthy Foods
Students illustrate their favorite food and add it to a food pyramid graph, after listening to Russell Hoban's story, Bread and Jam for Frances.
Curated OER
Graphs Abound
Young scholars create a survey for their classmates to collect data on their favorite foods, eye color, pets or other categorical data. They compile the data from the survey in a table and then make a bar graph of each category using a...
Curated OER
Pets: Stuffed Animal Day
Students bring in their favorite stuffed animals to class, and listen to the book, The Perfect Pet. They develop graphs for their stuffed animals, and create booklets titled, My Pet Book.
Curated OER
Cooking a Few of my Favorite Things
Second graders publish a class cookbook of their own recipes. They explore the nutritional value of foods, calculate the measurements, and prepare a healthy recipe for the class.
Curated OER
The Average Kid
Students determine the traits they have in common with other students in the class and create visual profiles of the "average" boy and the "average" girl.
Utah Education Network (UEN)
Balanced Diet
Second graders investigate the concept of a balanced diet and how the food pyramid is organized. They conduct research using the links included in the instructional activity. They differentiate the parts of the pyramid while looking at...
Curated OER
What Is It? Tommy Tastes
Students complete multi-curricular to learn about senses and sensory words. In this sensory words lesson, students discuss the five senses and the anatomy of a tongue. Students complete a food tasting activity and find descriptive words...
Curated OER
Which Has The Most?
Students are part of a class poll where they choose their favorite food and their favorite toy. In this which has the most lesson, students are given a block to represent their choice. Students then place the block by the picture of...
Curated OER
Survey Say...
Students examine a variety of charts and graphs that present data in a format that is easy to read. They work in groups to conduct a survey amongst their classmates. The data collected from the survey is then put on a bar graph.
Curated OER
Moo-Velous Butter!
Third graders investigate how temperature and motion (energy) create a chemical change that turns cream ( a liquid) into butter (a solid). They create a class pictograph of their favorite mils choices (white, chocolate, or strawberry)...
Curated OER
Apple Eaters
Students sample a variety of apples and graph group results for the class favorites. They orally explain the graph.
Curated OER
Chart/Graph
Learners create a class survey, place the data in a spreadsheet and graph the information.
Curated OER
Tasty Tech Activity With Excel
Students are introduce to basic Excel skills, rank their opinions of menu items from fast food restaurants, add their answers to the spreadsheet, and then create a simple graph of the results.
Curated OER
Statistics and Probablility
Statistics and Probability are all about collecting, organizing, and interpreting data. Young learners use previously collected data and construct a picture graph of the data on poster board. This stellar lesson should lead to...
Curated OER
Country Locations
First graders read a story and locate where the countries in the story are located. In this traditions lesson, 1st graders explore food dishes from different countries and discuss where they are located. Students tell their favorite...
Curated OER
Showing Favorites
For this tally chart worksheet, students use the tally chart on the page to answer 2 questions. They then solve the last 2 questions using their own tally chart.
CCSS Math Activities
Smarter Balanced Sample Items: 6th Grade Math – Claim 4
Develop a model for prep. The resource provides examples of how items reflect modeling and data analysis for Smarter Balanced assessments. Items use on-grade or below-grade content to focus on the modeling aspect. The questions revolve...


