Curated OER
SETI WebQuest and the Drake Equation
Students complete a WebQuest where they research the Internet for extraterrestrial intelligence. In this extraterrestrial lesson plan, students also explore how the Drake Equation can predict the occurrence of life elsewhere.
Curated OER
Student Costs Graph
Young scholars calculate the mileage, gasoline costs, and travel time and costs for a vacation. They conduct a virtual field trip, and create a comparison graph of costs using Microsoft Excel software.
Curated OER
Graphing Inequalities
In this inequality activity, students graph inequality equations on a coordinate plane. They shade in the coordinate plane to indicate the answer set. This two-page activity contains five problems.
Curated OER
Topic 3.4: Graphing Systems of Inequalities
In this inequality worksheet, learners graph systems of inequalities. Systems contain two to three equations. A coordinate plane for providing answers is located below each system. This two-page worksheet contains nine problems.
Curated OER
Inequalities and Their Graphs
In this algebra activity, learners identify the solution of an inequality. They graph their answers on a number line. There is an answer key to this problem.
Curated OER
Exploring Slope and Intercept
In this slope and intercept worksheet, students complete 23 problems involving sketching graphs, interpreting graphs, and interpreting slope.
Curated OER
Slopes of Lines
Learners examine a graph and relate it to the real world situation it depicts. They investigate changes in an equation and the appearance of a line. They investigate the connection between the graph of a situation and the meaning of the...
Curated OER
Parabolas
High schoolers investigate parabolas and their equations. In this parabolas and their equations lesson, students graph quadratic equations on their graphing calculator. High schoolers find the axis of symmetry of a parabola. Students...
Curated OER
Analytic Geometry
In this analytic geometry worksheet, 9th graders graph and solve 13 different types of problems that include determining whether equations are linear to matching given equations to their corresponding equation in the second column....
Curated OER
Circles
Students graph circles. In this graphing instructional activity students write equations for circles. Students solve equations for circles and graph the results.
Curated OER
Baseball Relationships - Using Scatter Plots
Students use graphing calculators to create scatter plots of given baseball data. They also determine percentages and ratios, slope, y-intercepts, etc. all using baseball data and statistics.
Curated OER
Slope and Intercept
In this slope and intercept worksheet, 10th graders solve 10 different problems that include the graphs of various forms of linear equations. First, they determine the slope of a line given the equation. Then, students determine if the...
Curated OER
Which Car Should I Buy?
Students use gas mileage of different cars to create T charts, algebraic equations, and graphs to show which gets better mileage. For this gas mileage lesson plan, students use the graph to see which car they should buy.
Curated OER
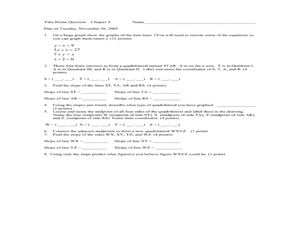
Take Home Question – Chapter 4
In this graphing linear equations worksheet, learners solve 8 short answer and graphing problems. Students graph linear equations, find their points of intersection, find the slope of each line, identify the constructed quadrilateral, etc.
Curated OER
Final Exam Review: College Algebra
For this final exam review worksheet,s students solve systems of equations, polynomials and factor quadratic equations. They identify the slope of a line and write linear equations. Students use Cramer's rule, graphing, substitution,...
Curated OER
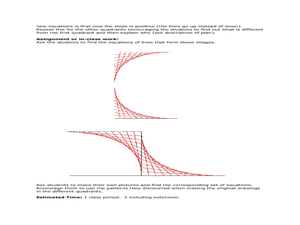
Mathematics of Doodles
Students use the slope and y-intercept to graph lines. In this algebra lesson, students graph linear equations and apply it to solving real life problems.
Curated OER
How Many Solutions to the System?
Solve systems of equation using graphing! In this algebra activity, students use the TI to graph two lines and identify the number of solutions. They perform interactive graphing on the navigator.
Curated OER
Slope-Intercept Form of a Line
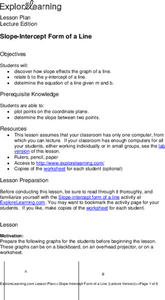
Students determine how the slope affects the graph of a line. They relate "b" to the "y"-intercept of a line and solve the equation of a line given "m" and "b." They are given scenarios and possible answers to which they explain why or...
Curated OER
Linear and Exponential Models
Students linearize data to determine if an exponential model is suitable. For this linearizing data to determine if an exponential model is suitable lesson, students graph the residuals of sets of data that appear to have an exponential...
Curated OER
Linear and Quadratic Functions
In this algebra worksheet, 11th graders solve quadratic functions using the quadratic formula. They take the square roots of both side of each equation then graph both the linear and quadratic functions. There are a total of 84 problems...
Curated OER
Linear Inequalities
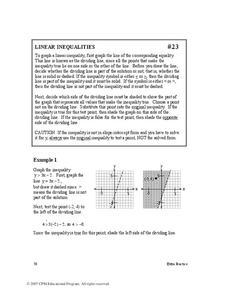
In this linear inequalities activity, students solve and graph systems of inequalities on a coordinate plane. Examples and explanations are provided. This five-page activity contains 32 problems. Answers are provided at the end of the...
Curated OER
Analyzing Data Sets
In this analyzing data sets worksheet, 11th graders solve and complete 35 various types of problems that include the analysis of data given. First, they determine the equation that best describes the data shown in a table. Then, students...
Curated OER
Topic 2.3 - Slope
In this slope intercept worksheet, students solve 15 problems in which they find the slope of a linear equation, the slope of a graph, the slope using 2 points, and the equation of a line parallel or perpendicular to a given line.
Curated OER
Functions and the Vertical Line Test
Students examine functions and function notation. They use computer activities to discover how to graph functions, and conduct a vertical line test. Students describe spatial relationships using coordinate geometry.
Other popular searches
- Graphing Equations 4th Grade
- Graphing Equations of Lines
- Graphing Equations Project
- Intro to Graphing Equations
- Graphing Equations Puzzle
- Ged Graphing Equations
- Algebra Graphing Lines
- Graphing Lines Quilt Pattern
- Graphing Equations on a Grid
- Systems of Equations Graphing
- Linear Equations and Graphing
- Linear Equations Graphing


