Hi, what do you want to do?
Concord Consortium
Concord Consortium: Stem Resources: Building a Zip Line
For this interactive, students plan, create, and test a zip line that will transport a hard-boiled egg without breaking it. They will make improvements on their design based on data about its performance. A motion sensor is required in...
TeachEngineering
Teach Engineering: Pointing at Maximum Power for Pv
Student teams measure voltage and current in order to determine the power output of a photovoltaic (PV) panel. They vary the resistance in a simple circuit connected to the panel to demonstrate the effects on voltage, current, and power...
TeachEngineering
Teach Engineering: Rooftop Gardens
Students explore whether rooftop gardens are a viable option for combating the urban heat island effect. Can rooftop gardens reduce the temperature inside and outside houses? Teams each design and construct two model buildings using foam...
TeachEngineering
Teach Engineering: Quantum Dots and Colors
Students are introduced to the physical concept of the colors of rainbows as light energy in the form of waves with distinct wavelengths, but in a different manner than traditional kaleidoscopes. Looking at different quantum dot...
TeachEngineering
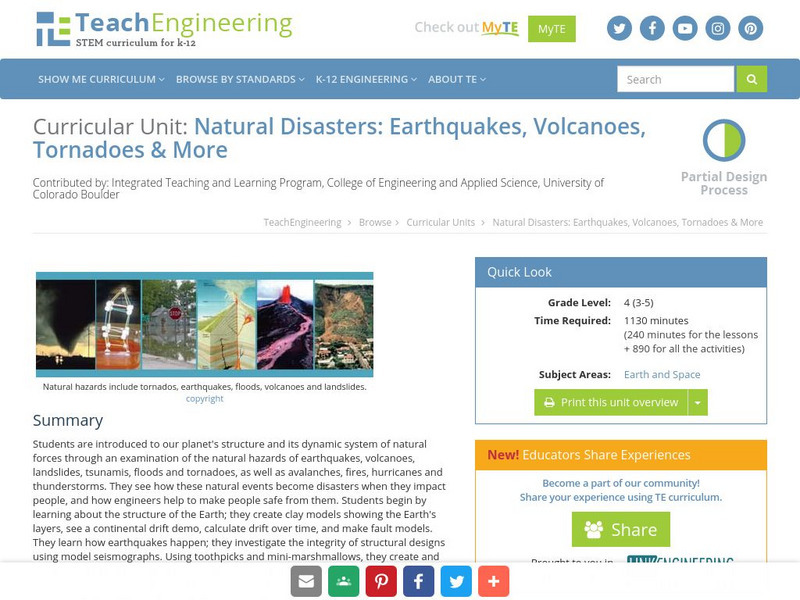
Teach Engineering: Natural Disasters
Students are introduced to our planet's structure and its dynamic system of natural forces through an examination of the natural hazards of earthquakes, volcanoes, landslides, tsunamis, floods and tornados, as well as avalanches, fires,...
EL Education
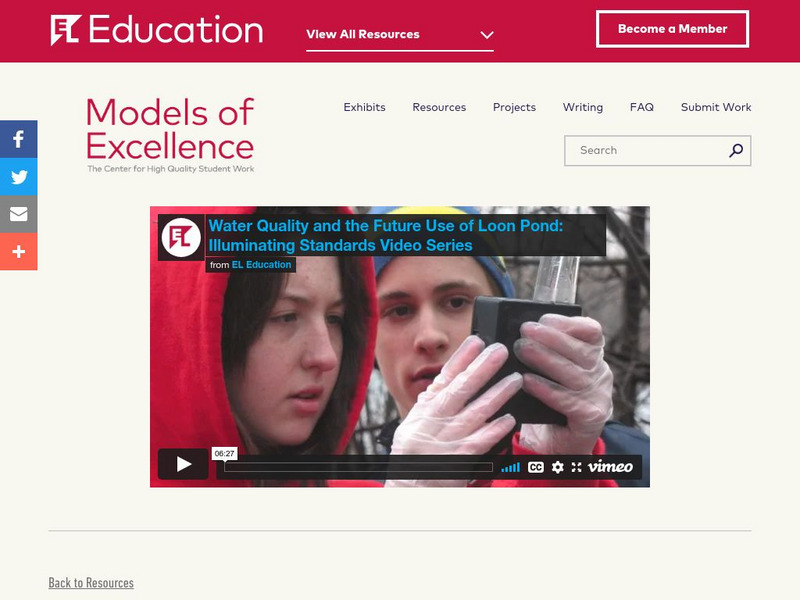
El Education: "Water Quality and Future Use of Loon Pond"
An online research report entitled "2007 Report on Water Quality and Future Use of Loon Pond" by ninth grade students from Renaissance Charter School in Springfield, Massachusetts. Students completed field work testing water and applied...
Alabama Learning Exchange
Alex: My Peanut Butter Is Better Than Yours!
The students will engage in the process of statistical data comparing data using tables and scatterplots. The students will compare data using measures of center (mean and median) and measures of spread (range). This lesson can be done...
Illustrative Mathematics
Illustrative Mathematics: F If.6 Mathemafish Population
For this task, students are presented with a table and a graph and are asked to summarize the data and report the findings of a project by the Environmental Protection Agency to contain the effects of an invasive species on a fish...
Alabama Learning Exchange
Alex: Statistically Thinking
The object of this project is for students to learn how to find univariate and bivariate statistics for sets of data. Also, the students will be able to determine if two sets of data are linearly correlated and to what degree. The...
Alabama Learning Exchange
Alex: How Sweet It Is
As part of the study of Matter, the students will determine the density of standard percent sugar solutions through hands on experimentation. In laboratory groups, students will graph a standardized curve of the experimental data. The...
Alabama Learning Exchange
Alex: Heads Up!
The lesson is a hands-on project. Students will work in pairs to gather various measurements, organizing the data into a provided chart. The measurements will be used to review, reinforce, and introduce skills such as measures of central...
Other
Valley City Junior High's Water Research: Water Issues
This site talks about the nitrate and nitrogen forms that can be found and how to test for it. Includes illustrative diagrams and graphs.
Alabama Learning Exchange
Alex: You Scream, I Scream, We All Scream for Ice Cream !
Fun and yummy lesson to do on a sunny spring afternoon. Have the young scholars take a poll of their favorite choice of ice cream and create a bar graph showing the information. This lesson plan was created as a result of the Girls...
University of Cambridge
University of Cambridge: Maths and Sports: David and Goliath
Does weight give shot putters an advantage? This activity encourages students to engage in statistical analysis, and is aimed at GCSE and A-level students (Key Stages 4 and 5).
Alabama Learning Exchange
Alex: Representing Possibilities
The students will work through problems that will be represented in tables, equations, and graphs. This lesson was adapted from NCTM Student Math Notes, May/June 2007.This lesson plan was created as a result of the Girls Engaged in Math...
Alabama Learning Exchange
Alex: Box and Whisker With a Bed Sheet
The class will make a list of all of their classmates heights, ages in months, and shoe sizes. They will then use this data to create a human box-and-whisker plot. This lesson plan was created as a result of the Girls Engaged in Math and...


