University Corporation for Atmospheric Research
Ucar: Project Sky Math
Teachers will be interested to explore the SkyMath module, and the 16 classroom activities at this site. In this program, students will collect and record real-time weather data to analyze. Data analysis, graphing, number relationship,...
National Council of Teachers of Mathematics
The Math Forum: Seventh Grade Mathematics: Data Sense
This site has some interesting ways to collect and evaluate data. There are some activities about note taking, spreadsheets, surveys, and a cool bridge construction project. Teachers may want to use this site as a resource for some...
Alabama Learning Exchange
Alex: Great Golly Graphs
This lesson plan asks middle schoolers to create a survey project including graphs, questions, tables, and data analysis. It gives an assessment and ideas for remediation and extension as well as ways to manage behavior problems and...
Science Buddies
Science Buddies: An Experiment in Visual Perception
Graphical methods of data presentation are a key feature of scientific communication. This project will get you thinking about how to find the best way to communicate scientific information.
Alabama Learning Exchange
Alex: "Ridin' Along in My Automobile"
Students will research prices of used cars to discover how automobiles lose their value over time. Students will create a chart to record their information, use their chart to graph their data, and find measures of central tendency of...
Alabama Learning Exchange
Alex: Incline Plane and the Crashing Marble
Learners will measure the effects of the height of an inclined plane on the force a marble produces to move a plastic, foam, or paper cup across a table. Students will discover that the higher the incline plane, the more force produced...
Alabama Learning Exchange
Alex: Misleading Graphs Are Da'pits!
In this interactive lesson, learners will discover how creating an incorrect graph will display misleading information. Through viewing and discussing a variety of graphs, the students will identify 5 components that graphs must contain...
Science Education Resource Center at Carleton College
Serc: Analyzing Greenhouse Gases and Global Temperature Data Over Time
In this activity, students plot data on the concentrations of various greenhouse gases in Earth's atmosphere and look for trends. They will learn that greenhouse gases allow the Sun's light to pass through them to the surface of Earth,...
US Department of Energy
United States Department of Energy: Power Metering Project
Two part lesson focuses on applying analytic tools such as pie charts and bar graphs to gain a better understanding of practical energy use issues. Young scholars will learn how different types of data collected affect the outcome of...
Alabama Learning Exchange
Alex: Bloodstain Pattern Doesn't Lie
Learners will formulate a hypothesis about the relationship (linear, direct, indirect, etc.) between the distance a drop of blood falls and the diameter of the splatter it makes. To test their hypothesis, the students will work...
Alabama Learning Exchange
Alex: Ice Cream Sundae Survey
Students quickly realize the importance of learning how to read and find information in charts, graphs, and tables compared to finding the same information written in a paragraph. This is a fun, high energy lesson!This lesson plan was...
Alabama Learning Exchange
Alex: Wheels All Around
Students will use skip counting to see how many wheels visit the school during specified times in one day. This lesson plan was created as a result of the Girls Engaged in Math and Science University, GEMS-U Project.
Alabama Learning Exchange
Alex: My Peanut Butter Is Better Than Yours!
The learners will engage in the process of statistical data comparing data using tables and scatterplots. The students will compare data using measures of center (mean and median) and measures of spread (range). This lesson can be done...
Illustrative Mathematics
Illustrative Mathematics: F If.6 Mathemafish Population
For this task, students are presented with a table and a graph and are asked to summarize the data and report the findings of a project by the Environmental Protection Agency to contain the effects of an invasive species on a fish...
Alabama Learning Exchange
Alex: Statistically Thinking
The object of this project is for students to learn how to find univariate and bivariate statistics for sets of data. Also, the students will be able to determine if two sets of data are linearly correlated and to what degree. The...
Alabama Learning Exchange
Alex: How Sweet It Is
As part of the study of Matter, the students will determine the density of standard percent sugar solutions through hands on experimentation. In laboratory groups, students will graph a standardized curve of the experimental data. The...
Alabama Learning Exchange
Alex: Heads Up!
The lesson is a hands-on project. Middle schoolers will work in pairs to gather various measurements, organizing the data into a provided chart. The measurements will be used to review, reinforce, and introduce skills such as measures of...
Alabama Learning Exchange
Alex: You Scream, I Scream, We All Scream for Ice Cream !
Fun and yummy lesson to do on a sunny spring afternoon. Have the young scholars take a poll of their favorite choice of ice cream and create a bar graph showing the information. This lesson plan was created as a result of the Girls...
Alabama Learning Exchange
Alex: Representing Possibilities
The students will work through problems that will be represented in tables, equations, and graphs. This instructional activity was adapted from NCTM Student Math Notes, May/June 2007.This lesson plan was created as a result of the Girls...
Alabama Learning Exchange
Alex: Box and Whisker With a Bed Sheet
The class will make a list of all of their classmates heights, ages in months, and shoe sizes. They will then use this data to create a human box-and-whisker plot. This lesson plan was created as a result of the Girls Engaged in Math and...
Science and Mathematics Initiative for Learning Enhancement (SMILE)
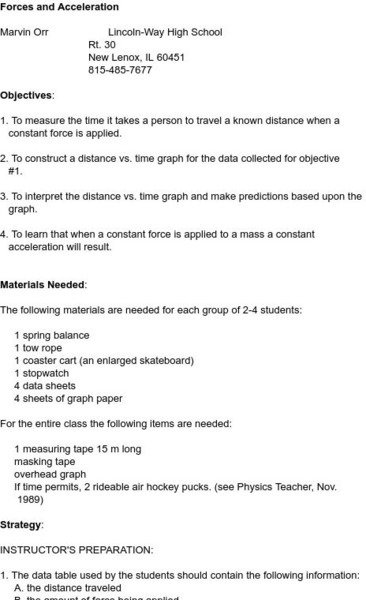
Smile: Lab Work Forces & Acceleration
The Illinois Institute of Technology provides this site. The site contains a graphing activity which illustrates that a constant force exerted upon an object results in constant acceleration. Rolling carts and stopwatches are used to...
Alabama Learning Exchange
Alex: Away We Go!
Students will survey various classes about the type of transportation that delivers them to school. Students will then combine data and with the help of a teacher create a virtual graph. This lesson plan was created as a result of the...


