Howard Hughes Medical Institute
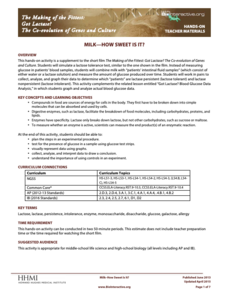
Milk—How Sweet Is It?
Have you ever wondered why some people are lactose intolerant? Participants test simulated patients in a hands-on lab activity to find out! They learn about lactose intolerance by performing an experiment, analyzing data, and drawing...
Howard Hughes Medical Institute
Got Lactase? Blood Glucose Data Analysis
Many physicals include a blood glucose test, but what are doctors actually testing? Scholars graph and interpret blood glucose data, allowing them to observe the differences in lactase persistence and draw conclusions. They then connect...
Baylor College
Body Strength
Your young learners will discover how muscular strength and endurance can increase with this truly hands-on activity! Beginning by writing an acrostic for the word strength, class members then engage in tracking their ability to squeeze...
Kenan Fellows
Designing and Analyzing Data Collected from Wearable Devices to Solve Problems in Health Care
Wearable devices have become more the norm than the exception. Learners analyze data from a sample device with a regression analysis in a helpful hands-on lesson. Their focus is to determine if there is a connection between temperature...
Curated OER
Energy Audit
Students collect data about energy usage and use mathematical calculations to analyze their data. In this energy conservation and statistics math lesson, students survey their homes to complete an energy usage worksheet. Students...
Curated OER
Now That's Using Your Head!
Explore linear measurement. Scholars will measure the circumference of their head and the distance they can jump. Information is recorded, averages are calculated, and a data table is completed. They then determine possible relationships...
Curated OER
Lab Experiments in Nutrition
Looking for authentic hands-on nutritional experiments? High schoolers will perform experiments to test for the presence of vitamin C in several solutions as well as the effect of caffeine on Daphnia. They will also consider the...
Curated OER
Nutrition and Food Security
Examine the three basic nutrients and their effects on the body. Fifth graders will research data to construct a bar graph and then demonstrate the relationship between malnutrition and food security. This is a very comprehensive...
University of Georgia
Energy Content of Foods
Why do athletes load up on carbohydrates the evening before a competition? The lesson helps answer this question as it relates the type of food to the amount of energy it contains. After a discussion, scholars perform an experiment...
Curated OER
Epidemiology: Graphing and Analyzing Health Data
Young scholars graph data on fetal and infant mortality rates collected by the Centers for Disease Control and Prevention. They identify trends in the data and propose potential causes for the trends.
Curated OER
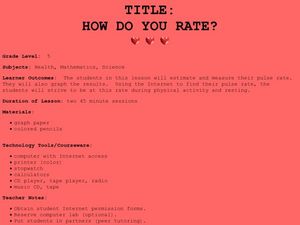
How Do You Rate?
Fifth graders make a graph. In this pulse rate lesson, 5th graders estimate their pulse and record it. Students measure their pulse while at rest and after physical activity and record it. Students use the internet to graph their results...
Centers for Disease Control and Prevention
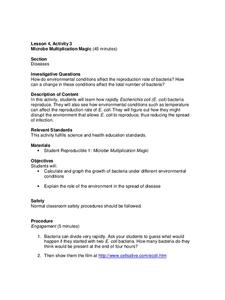
Microbe Multiplication Magic
A lesson introduces the reproduction rate of E. coli though a video. Then scholars complete a data table and graph of reproduction rates in ideal conditions as well as less than ideal conditions.
Baylor College
Body Mass Index (BMI)
How do you calculate your Body Mass Index, and why is this information a valuable indicator of health? Class members discover not only what BMI is and practice calculating it using the height and weight of six fictitious individuals, but...
Curated OER
What's Cooking?
Young scholars investigate solar energy by making sun tea. In this ecology and solar energy lesson plan, students prepare traditional tea and "sun" tea, then record and graph data comparing color, clarity, smell and taste.
Curated OER
Digestion & Nutrition: a Case Study
Students explore digestion/nutrition and utilize scientific investigation skills. They complete meal logs for several days and graph their results. After analyzing their data, they write formal lab reports.
Curated OER
Observation Milk Fat Lesson
Turn your class loose to experiment with the different fat content in skim milk, whole milk, half and half, and heavy cream. This is a visually vibrant experiment, as learners drip food coloring on the surface of the products and measure...
Beyond Benign
Product Test
It's the moment of truth. Previous lessons in the 24-part series had scholars design and develop shampoo formulas using chemical concepts. The 18th lesson asks them to test the function of their shampoos. To do this, they calculate the...
Curated OER
Interpreting Medical Data
Students explore human anatomy by graphing scientific data. In this vision lesson, students discuss how ophthalmology works and take their own eye assessment test using the Snellen chart. Students collect vision data from all of their...
Curated OER
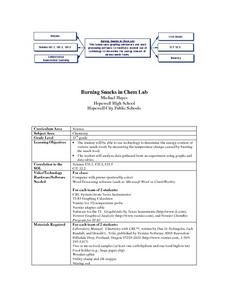
Burning Snacks in Chem Lab
High schoolers determine the energy content of various snack foods. They measure the temperature changes in various snack foods as the foods are burned in order to determine the foods' energy content. Students create graphs and data...
Curated OER
Blast the Fats
Students examine the fats found in foods. In this nutrition lesson, students identify the types and amounts of fats found in foods as they research food labels and the Internet. Students classify the fats and record their data.
Curated OER
Where's The Beef
Students create and conduct a survey in the community to evaluate the demographics of vegetarians in the community. They compile data, create graphs, calculate percentages, and draw conclusions about the survey data. Students create an...
Curated OER
Your Heart
Students explore human anatomy by defining vocabulary terms. In this human heart lesson, students research the components of the respiratory system and complete handouts based on the role of the heart. Students define a list of heart...
Curated OER
Testing for Vitamin C in different drinks and foods
Students develop an awareness of the use of Vitamin C in helping our environment and gain exposure to chemical procedures and techniques. Students analyze and interpret data by keeping a data sheet and making a bar graph.
Curated OER
Asthma Survey
Students collect survey data on the prevalence of asthma in a community. They summarize and display the survey data in ways that show meaning.
