Hi, what do you want to do?
Khan Academy
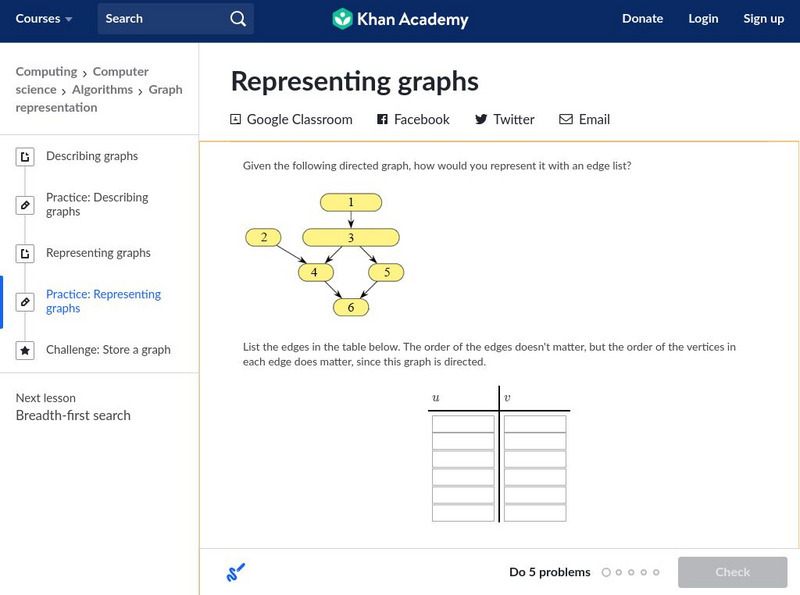
Khan Academy: Representing Graphs
Some practice problems with data and graph representation in computer science.
CK-12 Foundation
Ck 12: Physical Science: Scientific Graphing
[Free Registration/Login may be required to access all resource tools.] Usefulness and types of graphs.
Alabama Learning Exchange
Alex: "Ridin' Along in My Automobile"
Students will research prices of used cars to discover how automobiles lose their value over time. Students will create a chart to record their information, use their chart to graph their data, and find measures of central tendency of...
Scholastic
Scholastic: Dirtmeister's Science Lab: Let the Sun Shine In
Students graph data reflecting time of day and length of shadow, and then draw conclusions about Earth's seasons and position in relation to the Sun.
Texas Instruments
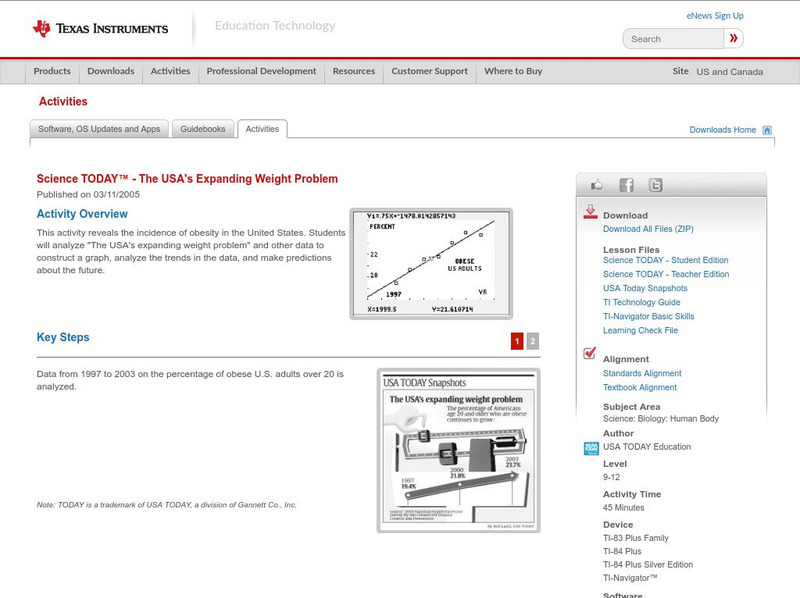
Texas Instruments: Science Today the Usa's Expanding Weight Problem
This activity reveals the incidence of obesity in the United States. Students will analyze "The USA's expanding weight problem" and other data to then construct a graph, analyze the trends in the data and make predictions about the future.
University of Utah
University of Utah: Genetic Science Learning Center: teach.genetics: Introduction to Heredity
A three-day unit introduces heredity by helping students identify their own genetic traits and then leading them in an exploration of generational traits and variation. Find printable worksheets, data tables, and graphs, as well as...
TeachEngineering
Teach Engineering: Graphing the Spread of Disease
Students simulate disease transmission by collecting data based on their proximity to other students. One option for measuring proximity is by having Bluetooth devices "discover" each other. After data is collected, students apply graph...
Khan Academy
Khan Academy: Storing Data in Variables
Practice variable assignment in the AP CSP pseudocode, in this set of free practice questions designed for AP Computer Science Principles students.
Texas Instruments
Texas Instruments: The Science of Racing: Time Laps
In this activity, you will create a picture of time and speed as they relate to changes in the weight of a radio controlled race car. This picture will be a graph - a mathematical model- that allows to you predict the speed of your radio...
Other
A River Runs Through It Learning Project
For this year long learning project integrating mathematics and science, students solve environmental problems using data collection and problem solving concepts. Designed for upper elementary gifted students. Interactive components and...
Center for Innovation in Engineering and Science Education, Stevens Institute of Technology
Ciese Collaborative Projects: Down the Drain: How Much Water Do You Use?
How much water do you use everyday? Find out in this engaging investigation, where you compare your water usage with your classmates and other people around the world. An exploration filled with lots of math and science that students are...
Other
Water on the Web
Water on the Web (WOW) is an advanced site allowing students to actively participate in data analysis from real research sites. Lesson plans on a range of topics are provided. There is also a tutorial for using Excel to graph WOW data.
Science Education Resource Center at Carleton College
Serc: Introduction to Texas Hurricanes
In this activity, students are asked to graph data about some 20th century hurricanes that hit the Texas coastline. For each graph, they are asked several questions about any apparent correlation between the different variables. Students...
My Science Site
Bj's Science: Take a Walk! [Pdf]
In this activity students literally walk through this activity calculating acceleration. Also, students calculate speed, graph acceleration, as well as do statistical data analysis. This resource is in PDF form; requires Adobe Reader.
Physics World
Physics World: Contextual Physics in Ocean Park
After downloading the "Motion Video Analysis" software, users can collect data about moving object's position from digital movie clips. This collection of data will allow them to plot motion graphs and draw conclusions about physics in...
ClassFlow
Class Flow: Fitting Models to Data
[Free Registration/Login Required] A basic premise of science is that much of the physical world can be described mathematically and many physical phenomena are predictable. This scientific outlook took place in Europe during the late...
PBS
Pbs: Mathline Creature Feature Lesson Plan [Pdf]
An interdisciplinary math, science, and language arts lesson that engages students in an exploration of statistics. Through a study of various forest climates, students utilize data collection and analysis, classification, and graphing....
Concord Consortium
Concord Consortium: Stem Resources: Building a Bungee Jump
Students are asked to create a bungee jump that will protect a hard-boiled egg from breaking. A force sensor is needed to measure the push/pull forces on the egg. Data is inserted into force-time graphs. After completing three...
TeachEngineering
Teach Engineering: Quantum Dots and Colors
Students are introduced to the physical concept of the colors of rainbows as light energy in the form of waves with distinct wavelengths, but in a different manner than traditional kaleidoscopes. Looking at different quantum dot...
Khan Academy
Khan Academy: Hexadecimal Numbers
The Hexadecimal number is explained as well as its relationship and need in computers.
Khan Academy
Khan Academy: Public Key Encryption
Public Key Encryption, an asymmetric encryption technique, is used to allow computers to securely communicate. The high level process is explained in this article.
Alabama Learning Exchange
Alex: You Scream, I Scream, We All Scream for Ice Cream !
Fun and yummy lesson to do on a sunny spring afternoon. Have the students take a poll of their favorite choice of ice cream and create a bar graph showing the information. This lesson plan was created as a result of the Girls Engaged in...
Alabama Learning Exchange
Alex: How Sweet It Is
As part of the study of Matter, the students will determine the density of standard percent sugar solutions through hands on experimentation. In laboratory groups, students will graph a standardized curve of the experimental data. The...
Texas Instruments
Texas Instruments: Are Your Bones Normal?
Students can use the TI-Navigator to investigate mathematics in Forensic Science.








![Bj's Science: Take a Walk! [Pdf] Activity Bj's Science: Take a Walk! [Pdf] Activity](https://static.lp.lexp.cloud/images/attachment_defaults/resource/large/FPO-knovation.png)


