Curated OER
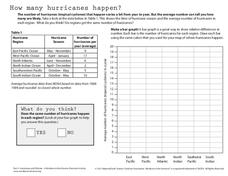
How Many Hurricanes Happen?
In this hurricanes worksheet, learners use a data table showing the hurricane region and the average number of hurricanes per year to determine if the same number of hurricanes happen in each region by creating a graph. Then students...
Curated OER
Global Warming Statistics
Young scholars research and collect data regarding temperature changes for a specific location and find the mean, median, and mode for their data. For this climate change lesson, students choose a location to research and collect data...
Curated OER
Boyle's Law
In this Boyle's Law worksheet, high schoolers investigate the relationship between the pressure and the volume of a gas at constant temperature. They use a syringe and a pressure gauge attached to a computer to collect their data. They...
Curated OER
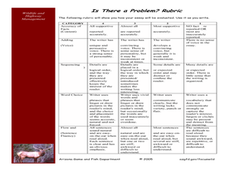
Is There a Problem with Wildlife on our Roads?
Students create a graph and analyze it to see if the data shows there is a problem with wildlife on the roads. In this wildlife collision lesson students write an essay to support their conclusions.
Curated OER
Galileo's Battle for the Heavens
Students view a video about Galileo's discoveries. They work together to create graphs showing the current sunspot cycle. They discuss how sunspots can cause communication devices problems.
Curated OER
Mapping the Ocean Floor
Students construct and interpret a line graph of ocean floor depth and a bar graph comparing the height/depth of several well-known natural and man-made objects and places. In addition, they calculate the depth of two points using sonar...
Curated OER
Seasonal Cloud Cover Variations
Students, in groups, access data from the NASA website Live Access Server regarding seasonal cloud coverage and the type of clouds that make up the coverage. They graph the data and make correlations between types, seasons and percentages.
Curated OER
Health of Aquatic Life a Real Problem
Learners explore the health of aquatic life in this science lesson They measure and track the oxygen level in the water to determine the health of the aquatic life. They collect this data using the TI explorer to graph and analyze their...
Curated OER
The "Clock Reaction" Kinetics Lab
Students investigate the effects of temperature and concentration on the rate of reactions. In this "clock reaction" kinetics lesson plan, students change the concentration of one reactant and keep the second constant. An indicator is...
Curated OER
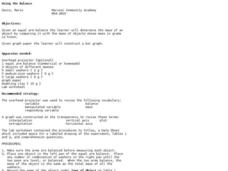
Using the Balance
Learners determine the mass of various objects. In this integrated math and science lesson, students use an arm balance to compare a known object to a combination of washers with a fixed weight. Learners record data, construct a bar...
Curated OER
Inclined Plane and Pulley
Students describe how inclined plane and pulleys make work easier. In this physics lesson plan, students calculate work done and mechanical advantage of both simple machines. They collect data from the experiment and construct graphs.
Curated OER
Pika Chew
Students work in collaborative teams with specific roles, use the Internet to research the behavior and ecology of pikas, make predictions about survival rates of pikas in different habitats and organize their data in graphs.
Curated OER
Under the Sea - Ocean Mammals/Fish
Students explore the similarities and differences between ocean mammals and fish. The characteristics of the life forms observed are placed onto a graph. The classroom becomes the botom of the sea and is explored to gain the required data.
Curated OER
Cool Cars
Students travel one at a time in a straight-line path and attempt to maintain a constant velocity. While one student walks, jogs, or runs, the other group members time the "runner" while standing at five-meter intervals along the path....
Texas Instruments
Land Erosion - Running Off With Soil
Learners evaluate the relationship between rainfall and runoff of a small island for one year. In this rainfall vs. runoff lesson, students analyze the relationship between the rainfall and the runoff on Barro Colorado Island over a...
Curated OER
Student - Designed Density Experiment and Poster
In this student-designed experiment worksheet, students decide on an experimental problem to solve. Students use the scientific method to perform an experiment and record the data. Students calculate the density of liquid used in the...
Curated OER
Slope of a Line
In this slope of a line activity, students read about line graphs and plotting the slope of a line. They read about the rate of change which is represented by the slope. Students practice finding the slope of lines.
Curated OER
Acceleration 2
In this acceleration activity, students experiment with varying amounts of mass to observe the effects on the force needed to move an object. Students apply Newton's Second Law of Motion to describe the relationship between mass and...
Curated OER
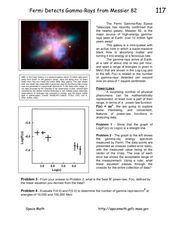
Fermi Detects Gamma-Rays from Messier
In this power law function worksheet, students use data from the Fermi Gamma-Ray Space telescope to apply the power law function to physical phenomena. Students use a graph to solve four problems.
Curated OER
Is There Liquid Water on Mars?
Students assess whether there is liquid water on Mars by analyzing images and data. In this planetary lesson students analyze temperature and pressure graphs and hypothesize about how water could have flowed on Mars.
Curated OER
Polluting the Environment
Fourth graders construct mini-ecosystem, pollute the ecosystem, observe, collect, and record data on the effects of these pollutants on their ecosystem, organize data on spreadsheets, create graphs, and design presentations to share with...
Curated OER
Relating to Newton's Second Law
Twelfth graders study the relationships of the 3 variables in Newton's Second Law. They design an experiment to test the relationships among the variables. Students work cooperatively with members of a team. They also analyze data to...
Curated OER
Let the River Run
Pupils examine deposits found in a river in this science lesson. They collect data of sediment deposit found in the Mississippi river, then graph and analyze their data using the TI.
Curated OER
Insect Monitoring
Middle schoolers participate in an interactive lesson using the scientific method to study biodiversity. In this insect monitoring lesson, students simulate the layers of soil and the insects that would live there. Middle schoolers...
Other popular searches
- Data Analysis Graphing
- Graphing and Analyzing Data
- Data and Graphing
- Graphing Data Project
- Collecting and Graphing Data
- Graphing Data in Science
- Collecting Data Graphing
- Organizing and Graphing Data
- Mathematics Graphing Data
- Data Tables and Graphing
- Line Graphing Data
- Graphing Data in Astronomy


