Curated OER
Density of Pennies Lab
In this density of pennies worksheet, student conduct an experiment to determine the metals used in the core of pennies made after 1983. Students design their own experiments using a balance and graph paper to determine the density of...
Curated OER
The Big Bang-Hubble's Law
In this Hubble's law worksheet, students use data for galaxies which include their distance and speed. Students make a graph to show the distance to each galaxy and the speed of each galaxy. They use their graph to answer 4 questions...
Curated OER
The Global Warming Debate and the Arctic Ice Cap
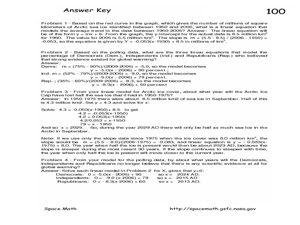
In this global warming and the Arctic ice cap worksheet, students use two graphs showing data about the amount of Arctic sea ice between 1950 and 2006 and the percent of people surveyed that believe the Earth has gotten warmer over the...
Curated OER
Measuring Rainfall and Relationships Between pH, Alkalinity and Suspended Solids in the Pago River
Eleventh graders test the pH and alkalinity of Pago River. In this ecology lesson, 11th graders collect data and use spreadsheet to graph results. They analyze and share their findings with the class.
Curated OER
Biodiversity and Ecosystems
Middle schoolers differentiate between biotic and abiotic factors in this science instructional activity. Learners collect data for the experiment and analyze the data after graphing it using the CBL 2. This experiment is split into two...
Curated OER
Specific Heat of Air and Soil
Students are introduced to the concept of specific heat. In groups, they are given a set of data showing the temperatures of air and soil samples in which they calculate the ranges of the data. They identify whether the air or soil...
Curated OER
An Inventory of My Traits
Students take an inventory of their own easily-observable genetic traits and
compare those inventories with other students in groups. They then make
data tables and bar graphs showing the most and least common traits in their group.
Curated OER
Bean Sprout
Student will track the growth of his/her bean sprout with sunlight and without sunlight over the course of 3 weeks. They will enter the results into an excel data base then graph the results of both variables to make the comparison.
Curated OER
An Inventory of My Traits
In this biology activity, students identify and describe a number of easily observable genetic traits and compare the traits they have with other students. Then they identify and describe that some traits are common while others are not...
Curated OER
Lifting a Load
Students experiments with levers to determine if the amount of force needed to lift a load is always the same. In this physics instructional activity, students use Lab-Pro data collector as they experiment with the fulcrum placement to...
Curated OER
Motion: Speed, Velocity, Acceleration and Networking
Students interpret a variety of motion graphs. In this physics lesson, students calculate the speed and acceleration of objects using numerical data from graphs. They apply what they have learned to solve real world problems.
Curated OER
Conducting a Scientific Investigation
Learners investigate a possible health problem in the local school district through inquiry into attendance records, activities, maps, graphs, and data tables. The simulation continues as solutions for the problem are sought.
Curated OER
How Texas is Planning To Manage Its Water
Students research water management strategies in Texas. They analyze projected demand for water in the year 2050, interpret graphs and tables and then discuss the data as part of a written report. They research and map the locations of...
Curated OER
Lobster Roll!
Students collect data by playing a game that illustrates the delicate ecological balance between fishing, fishing regulations and fish populations. They graph and analyze the data and explain how economic decisions can affect the...
Curated OER
The Disappearing Kelp Forest
Learners observe the effect "El Nino" left on kelp plants and sea urchins. They analyze the data collected by researchers, by graphing it on a TI calculator. Before graphing and analyzing the data, you may want to revisit the events of...
Curated OER
Locating the Salt Front - Section 1
In this salt front of the Hudson River learning exercise, 7th graders first read an excerpt about the lower portion of the Hudson River that is an estuary. Then they use a colored pencil to plot salinity data from the table shown on a...
Curated OER
Is the Hudson River Too Salty to Drink?
In this estuary worksheet, learners examine data about the salinity of the Hudson River, create a graph from given data and complete 12 short answer questions about the data and graph.
Curated OER
Predator-Prey Simulation
Students simulate a predator-prey interaction in an ecosystem. Students use different size squares cut from paper to represent predators and prey. They simulate the interactions of the species by following instructions for the capture of...
Curated OER
How Many Hurricanes Happen?
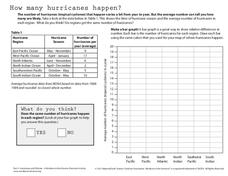
In this hurricanes worksheet, students use a data table showing the hurricane region and the average number of hurricanes per year to determine if the same number of hurricanes happen in each region by creating a graph. Then students...
Curated OER
Global Warming Statistics
Learners research and collect data regarding temperature changes for a specific location and find the mean, median, and mode for their data. In this climate change lesson, students choose a location to research and collect data regarding...
Curated OER
Boyle's Law
In this Boyle's Law worksheet, high schoolers investigate the relationship between the pressure and the volume of a gas at constant temperature. They use a syringe and a pressure gauge attached to a computer to collect their data. They...
Curated OER
Is There a Problem with Wildlife on our Roads?
Learners create a graph and analyze it to see if the data shows there is a problem with wildlife on the roads. In this wildlife collision instructional activity students write an essay to support their conclusions.
Curated OER
Galileo's Battle for the Heavens
Young scholars view a video about Galileo's discoveries. They work together to create graphs showing the current sunspot cycle. They discuss how sunspots can cause communication devices problems.
Curated OER
Mapping the Ocean Floor
Students construct and interpret a line graph of ocean floor depth and a bar graph comparing the height/depth of several well-known natural and man-made objects and places. In addition, they calculate the depth of two points using sonar...
Other popular searches
- Data Analysis Graphing
- Graphing and Analyzing Data
- Data and Graphing
- Graphing Data Project
- Collecting and Graphing Data
- Graphing Data in Science
- Collecting Data Graphing
- Organizing and Graphing Data
- Mathematics Graphing Data
- Data Tables and Graphing
- Line Graphing Data
- Graphing Data in Astronomy


