Curated OER
Energy Conservation Lesson 1: Fossil Fuels and the Ticking Clock
Students explore energy production by participating in a class discussion. In this renewable energy instructional activity, students discuss the differences between solar, coal, wind and fossil fuel energy sources and why some are better...
Curated OER
Atomic Candy
Mmmmm! Radioactive "candium!" Nuclear physics or chemistry classes use M&M'S® to demonstrate the process of radioactive decay. Individuals pour out a bag of candies and record the number that fall M-side-up to represent the number of...
University of Georgia
Energy Content of Foods
Why do athletes load up on carbohydrates the evening before a competition? The lesson helps answer this question as it relates the type of food to the amount of energy it contains. After a discussion, scholars perform an experiment to...
Curated OER
Get a Leg Up
Traveling through space is an amazing experience, but it definitely takes a toll on the body. After reading an article and watching a brief video, learners perform an experiment that simulates the effects of zero gravity on the human body.
Curated OER
Circle the Earth - Explore Surface Types on a Journey around Earth
Students use CERES percent coverage surface data with a world map in locating landmasses and bodies of water at Earth's Equator.
Curated OER
Weather Plots
Students investigate the relationship between temperature and humidity. The graphs of weather data gathered and plotted for for an assigned period of time are analyzed and the interpretations shared with the class.
Curated OER
Highs and Lows
Students use email to chart weather patterns and then graph their findings. In this weather patterns lesson, students chart their weather for a week at the school. Students then use email to find temperatures at a variety of locations....
Curated OER
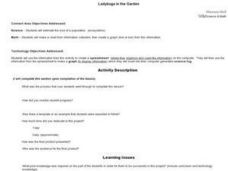
Ladybugs in the Garden
Fifth graders estimate the size a population (ecosystems) Students make a chart from information collected then create a graph (line or bar) from this information. Students do a lesson where they observed, examine, and record data...
Curated OER
What's Your Wingspan?
Third graders measure each other's wingspan, and record and analyze the data.
Curated OER
Marine Debris on the Chesapeake Bay
Students use website to study estuarine debris data. They study the density of marine debris.
Curated OER
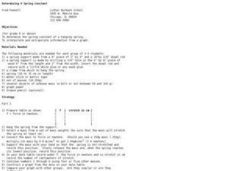
Determining A Spring Constant
Students determine a spring constant and extrapolate information from a graph. In this spring lesson students divide into groups and complete a lab activity.
Curated OER
Where Have All the Salmon Gone?
Students watch a video and examine why several species of salmon in the Puget Sound have been placed on the endangered species list. They analyze and graph data about the salmon and discuss how the issue effects all who live in the Puget...
Curated OER
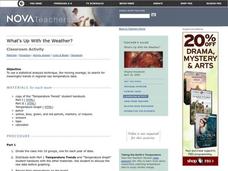
What's Up With the Weather?
Students examine raw data about temperatures throughout the world and record their observations. They work together to graph a specific year of data. They calculate an average temperature and discuss their findings.
Curated OER
Differences between Climate and Weather
Students collect weather data over weeks, graph temperature data and compare the temperature data collected with averaged climate data where they live.
Curated OER
Global Warming Statistics
Students research real-time and historic temperature data of U.S. and world locations, and analyze the data using mean, median, and mode averages. They graph the data and draw conclusions by analyzing the data. A spreadsheet is used to...
Curated OER
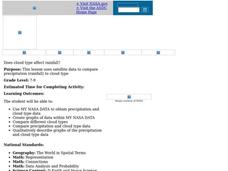
Does Cloud Type Affect Rainfall?
Student uses MY NASA DATA to obtain precipitation and cloud type data. They create graphs of data within MY NASA DATA. They compare different cloud types as well as precipitation types. They describe graphs of the precipitation and cloud...
Alabama Learning Exchange
Inch by Inch
Third graders listen to a read-aloud of Leo Lionni's, Inch by Inch before measuring a variety of items using both standard and metric units. They record the measurement data and follow a recipe for dirt pie.
Curated OER
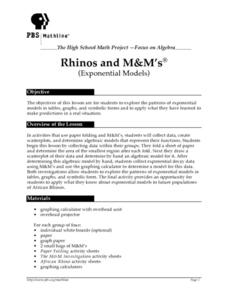
Rhinos and M&M's
Students analyze patterns of exponential models by collecting data in paper folding and M&M investigations. They use graphing calculators to create scatter plots that lead to equations for the exponential models. They then apply this...
Curated OER
Dinosaur Tracks: From Stride To Leg Length To Speed
Students determine the relationship between leg length, stride length, and speed in humans and bipedal dinosaurs. They collect data and graph these human characteristics then use actual data collected from dinosaur track pads and fossils...
Curated OER
Getting to the Core of Climate Change
Learners investigate climate changes by graphing and analyzing ice core data from Greenland and Antarctica. They create, explain and report the pattern of data on a graph of ice core data. In addition they find relationships between the...
Curated OER
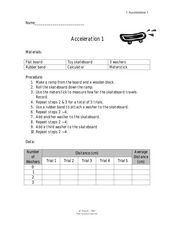
Acceleration 1
For this acceleration worksheet, students use weights to increase the mass affecting the force on moving objects. Students plot a graph of their data and answer 3 questions about how the acceleration of the toy skateboard used in the...
Curated OER
The Effects of Light Intensity and Wavelength on the Rate of Photosynthesis
Students use an on line website to simulate the effects of light intensity and wavelength on photosynthesis. In this photosynthesis lesson plan, students determine how wavelength of light and intensity of light affect the rate at which...
Curated OER
Temperature High and Lows
Young scholars gather high and low temperature readings through email. In this temperature graphing activity, students use a spreadsheet to input data for a graph. young scholars interpret the graphs to compare and contrast the data from...
Curated OER
Take a Walk
Sixth graders graph acceleration and practice using the metric system. In this physics lesson, 6th graders take turns timing each other as they walk 15 meters. Students then chart and graph their data using the metric system.
Other popular searches
- Data Analysis Graphing
- Graphing and Analyzing Data
- Data and Graphing
- Graphing Data Project
- Collecting and Graphing Data
- Graphing Data in Science
- Collecting Data Graphing
- Organizing and Graphing Data
- Mathematics Graphing Data
- Data Tables and Graphing
- Line Graphing Data
- Graphing Data in Astronomy


