Curated OER
Dependence of Light Intensity on Distance
Hopefully you have a sensor interface for your physics class to use with graphing calculators when collecting data with a light sensor. If so, read on. Use this resource for learners to predict and then test whether or not the intensity...
Curated OER
Time That Period
Physical science starters play with a pendulum in order to experience periodicity. Detailed procedures and a worksheet are included for day one. For day two, learners will use a graphing calculator to help them plot orbit data from a...
Pingry School
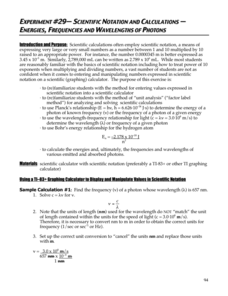
Scientific Notation and Calculations – Energies, Frequencies, and Wavelengths of Photons
The calculator has an interesting way of displaying numbers in scientific notation, but don't let that confuse your pupils! A lesson designed to give learners practice with scientific notation and calculators provides several practice...
Curated OER
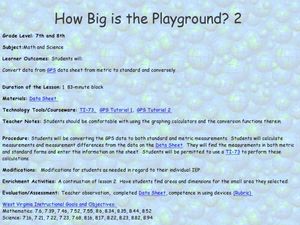
How Big Is The Playground?
Students calculate the standard and metric measurements of a playground. In this measurement lesson, students use GPS coordinates and graphing calculators to determine the dimensions of an area outside of the school in both standard and...
Curated OER
Ashes to Ashes: Using Evaporation Rate to Identify an Unknown Liquid
Learners explore the concept of evaporation rates in this evaporation rates lesson. They will try to identify the chemical that began a fire, perform an experiment where they use the evaporation rates to determine the unknown liquid, and...
Curated OER
Bouncing Ball
Students collect height versus time data of a bouncing ball using the CBR 2™ data collection device. Using a quadratic equation they graph scatter plots, graph and interpret a quadratic function, apply the vertex form of a quadratic...
Curated OER
Coming to Know F and C
Students collect temperatures using a probe and examine data. In this temperature lesson students complete an activity using a graphing calculator.
Curated OER
Hit and Run
Pupils explore data collection in this instructional activity. They investigate distance vs. time and velocity vs. time graphs using information collected with a CBR 2 to simulate the reconstruction of an accident.
Curated OER
The Cricket and The Plant
Students examine determine the symbiotic relationship between plants and animals as the find ways to naturally reduce carbon dioxide emissions. They study the carbon cycle. They work with probe and graphing calculator to examine the...
Curated OER
Investigating Motion
Learners determine velocity using the slope of a time distance graph. They investigate a motion cart using a CBR unit and a TI 83 calculator setup. Using the graph generated, they calculate velocity.
Curated OER
Bacteria Buddies
Tenth graders grow two different bacteria cultures. They count the colonies, and then use graphing calculators to predict the number of colonies that are going to appear. Students answer questions from their worksheet after completing...
Curated OER
Skittles and Springs
Learners experiment to discover the relationship between the stretch of a spring and the amount of weight attached to the spring using Skittles. They use a CBR and a graphing calculator to gather data.
Curated OER
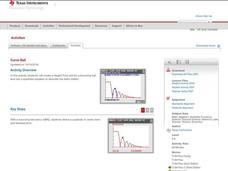
Curve Ball
Learners explore the concept of parabolas by collecting quadratic data on a bouncing ball as it is falling using a motion detector. They plot the data and determine the equation of the quadratic in vertex form, then determine the values...
Curated OER
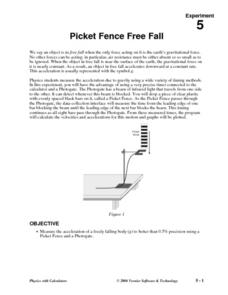
Picket Fence Free Fall
Students measure acceleration using a Picket Fence and a Photogate. For this physics lesson, students drop an object and measure the acceleration of the object free falling. They log their data using the TI.
Curated OER
Burning Snacks in Chem Lab
Students determine the energy content of various snack foods. They measure the temperature changes in various snack foods as the foods are burned in order to determine the foods' energy content. Students create graphs and data tables of...
Curated OER
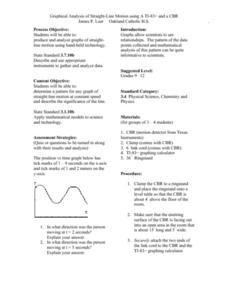
Graphical Analysis of Straight-Line Motion
Learners investigate the concept of straight line motion. They determine the pattern and graph it looking for the motion maintained at a constant speed. Students also write a description of the significance of the line. The skill of...
Curated OER
Determining the Relationship Between pH and Hydrogen Ions with Microcomputer Based Lab (MBL) and/or Calculator Based Lab (CBL) Equipment
Learners find the relationship between the variables based on experimental data. They determine mathematical relationship between pH and the amount of hydrogen Ions in solution.
Curated OER
Batteries in Series: Voltage and Light Intensity
Young scholars participate in a hands-on activity to explore the relationship between the number of batteries in a series circuit and its voltage. Students identify the relationship between two variables and plot points on a graph.
Curated OER
A New Phase In Town
Middle schoolers explore heat energy and how it is used to change the phase of matter, and discover that temperature does not increase or decrease until the phase change is complete. This extremely well-written plan is packed with great...
Curated OER
Marine Mammal Diving Reflex
Tenth graders discuss marine mammal diving reflex, and measure pulse rate while holding their breath under three conditions: control, warm water, and ice water to determine if humans exhibit marine mammal diving reflex.
Curated OER
Monitoring Oxygen Level
Students measure oxygen percentages in room air and air exhaled after they perform various activities. They explore various websites, and record and analyze the data from the experiments.
Curated OER
High and Low Tides
Students collect real world data from the Web regarding high and low tides at various locations in the United States. They find a function which models this data and make predictions on tide levels based on the information found.
Curated OER
To Drink or not to Drink
Seventh graders discuss water quality, water availability and water resources and how water is used in the world around them. They view a video on water quality then test for pH, temperature and dissolved oxygen to indicate water quality.


