Curated OER
Population Pyramids
Young scholars work with and make population pyramids. In this population pyramid lesson, students use census data to make population pyramids for China, India, and the United States. They use the information to determine why jobs are...
Curated OER
Strike a Pose: Modeling in the Real World (There's Nothing to It!)
Adjust this lesson to fit either beginning or more advanced learners. Build a scatter plot, determine appropriate model (linear, quadratic, exponential), and then extend to evaluate the model with residuals. This problem uses real-world...
Curated OER
Dying to Be Thin
Students view a video clip about how men and women are portrayed in the media. They gather examples from magazines and graph the results. They discuss body image to end the lesson.
Curated OER
Collect Data Using a Transect Line
Young scholars learn about transect lines through a study of marine debris. In this marine debris lesson, students calculate the items on a transect line and graph them. Young scholars complete a category worksheet.
Curated OER
Nutrients by the Numbers
Students read and discuss an article on the amount of sugar in various food products. They compare the nutritional values of food products, calculate their daily intake of nutrients, analyze serving sizes, and compare/contrast their own...
Curated OER
Fantasy Basketball
Students play Fantasy Basketball in order to practice locating Internet information and using technology tools to display data; students demonstrate an understanding and use of graphing, probability, and statistics.
Curated OER
Interpreting Data and Building Hypothesis
Students define the term species, and graph species data together with previously collected data at the National Zoo. They interpret graphed data and recognize patterns in the streamside quadrant versus hillside quadrant. Students use...
Curated OER
Which Way?
Middle schoolers explore distance-time plots. In this algebra activity, they will investigate how different types of motion affect the distance-time plot.
Curated OER
Take a Walk
Sixth graders graph acceleration and practice using the metric system. In this physics lesson, 6th graders take turns timing each other as they walk 15 meters. Students then chart and graph their data using the metric system.
Texas Instruments
Buying Your First New Car!
Learners explore exponential growth and decay using M&M’s in this Algebra II/Pre-calculus lesson plan. They investigate the cost of a new car by calculating depreciation and payments.
Curated OER
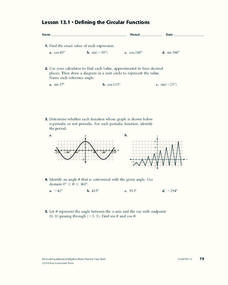
Defining the Circular Functions
In this calculus instructional activity, students solve values involving trigs and the unit circle. They identify graphs of sine, cosine and tangents. They solve for angles using the unit circle and the calculator.
Curated OER
Lines of Fit
Students analyze graphs. In this algebra lesson, students find the line of best fit, using scatter plots. They calculate the sale of popcorn as it relates to the price. They then analyze the graphs for positive, negative and no correlation.
Curated OER
Lines of Fit
Students solve equations dealing with best fit lines. For this algebra lesson, students solve problems by analyzing data from a scatterplot, and define it as positive, negative or no correlation. They classify slopes the same way as...
Curated OER
Moooving to Low-fat Milk
Third graders complete two handouts. In this healthy beverages lesson, 3rd graders compare whole, two percent and skim milks. Students use labels to help choose healthy beverages. Students complete an "All About Milk" and "Calculating...
Curated OER
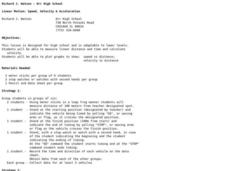
Linear Motion: Speed, Velocity & Acceleration
Students explore the concept of linear motion. In this linear motion lesson, students calculate distance and time in order to calculate average speed and velocity in the provided problems.
Curated OER
Golden Ratio
Tenth graders investigate the Golden Ratio. In this geometry lesson, 10th graders explore the Fibonacci sequence in the context of The Fibonacci Rabbit problem. Students examine how the ratio of two consecutive Fibonacci number create...
Texas Instruments
A Tale of Two Lines
Students graph systems of equation. In this calculus lesson, students graph their lines on a TI calculator. They identify the point of intersection and the type of solution.
Curated OER
Euler's Method Introduction
Young mathematicians define and use Euler's method to solve problems in this calculus lesson. Learners visualize graphs and solve differential equations. They create these visuals on the TI calculator.
Curated OER
Rate of Change
Young scholars observe and calculate slopes. In this algebra lesson, students graph equations and determine the pace at which the slope is changing. They use the navigator to see the change as they graph the lines around.
Curated OER
Let's Go Shopping: Estimation At The Mall
Students estimate the total cost of a shopping trip. In this estimation lesson, students use three different techniques to estimate how much a shopping trip will cost.
Curated OER
Lobster Roll!
Students collect data by playing a game that illustrates the delicate ecological balance between fishing, fishing regulations and fish populations. They graph and analyze the data and explain how economic decisions can affect the...
Curated OER
Wrapping It All Up
Through learning how to examine linear, quadratic, and exponential functions, students explore the effects of changes in parameters on the graphs of linear, quadratic, and exponential functions. The instructional activity is designed to...
Curated OER
Standard Form of Equations
Learners complete the square and identify different parts of a quadratic equation. In this algebra lesson, pupils graph conics using the TI calculator. They rewrite equations by completing the square.
Curated OER
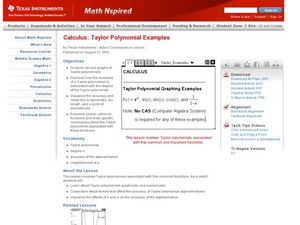
Taylor Polynomial Examples
Students graph Taylor polynomials. In this calculus lesson, students relate accuracy of a Taylor polynomial to the degree of the equation. They graph their polynomials using the TI calculator.


