Curated OER
Cut It Out!
Students calculate the surface area of polygons. In this geometry lesson, students use spacial reasoning to find the answer to their problem. They analyze solids and create formulas to estimate the measurements of the area.
Curated OER
Don’t Sit Under the Apple Tree…You Might Become Famous
Students explore Newton's laws using CEENBoTs. In this physics lesson, students collect data and create tables and graphs. They calculate speed, acceleration and forces using mathematical formulas.
Curated OER
Amusement Park Physics
Students get up close and personal with principles of motion. In this physics lesson, students collect and analyze acceleration data on amusement park rides. Students use CBLs to collect data in this lesson.
Curated OER
Fire!, Probability, and Chaos
Students explore the concept of probability. In this probability lesson, students simulate a controlled forest burn using an applet. Students vary the probability of trees burning and predict what will happen.
Curated OER
What Happened to the Mean and Median
Students find the mean, median and mode. In hs statistics lesson, students collect, plot and analyze data. The identify the effect the central tendency have on the data and line.
Curated OER
How Much Data is That?
Middle schoolers differentiate between exponential and logarithmic functions. In this algebra lesson, students use logarithmic properties to solve equations. They identify growth and decay of graphs.
Curated OER
Playing With Probability
Learners rotate through work stations where they compute problems of theoretical and experimental probability. In this probability lesson plan, students use simulations of a lottery system.
Curated OER
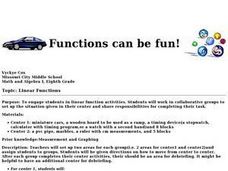
Functions Can Be Fun!
Eighth graders work together in groups to discover linear functions. They are giving a situation and they are to recreate it in their groups. They answer questions to complete the lesson.
Curated OER
Comparing Earth and Mars
Students work together to compare and contrast Mars and Earth. Using the internet, they answer questions given to them by their teacher and calculate answers showing their work. They graph their answers and discuss the results of the...
Curated OER
M & M Candy: I Want Green
Eighth graders use colored candy pieces (such as M & M's) to compare mathematical expectations and experimental probability. They pick pieces of candy randomly, and graph their results. This classic lesson never fails to engage...
Curated OER
Roller Coaster Robot
Students calculate the area under a curve. In this calculus instructional activity, students use Riemann sums to find and approximate the area under a curve. They use the derivative and differential equations to solve.
Curated OER
Tracking Your Favorite Web Sites
Ninth graders track the hit count on their favorite web sites. In this Algebra I lesson, 9th graders record the number of hits on their favorite web site for twenty days. Students explore the data to determine if the relation defines a...
Curated OER
Working Watermelon
You're going to wish you had a watermelon for this lesson! Class members read about watermelons and make a salad in class to sample. They also perform estimates, measurements and calculations on a watermelon. They predict what percentage...
Curated OER
Mean and Median
Students define mean and median. In this "average" lesson, students calculate the mean and median for a list of given numbers.
Curated OER
Parabolas Exist Where?
Young scholars recognize how parabolas are used in architecture and calculate a constant of variation.
Curated OER
Best Guesser
Fifth graders develop strategies for estimating ages, and illustrate results by graphing and interpreting scatter plots to compare x and y coordinates.
Curated OER
Parabola
High schoolers develop a definition of parabola and explain the relationship between the properties of the graph of a parabola and its equation. They explain how the equation of a parabola can be written in different forms and solve...
Texas Instruments
Say What You Mean!
Students analyze data and identify the mean. In this probability lesson, students log data in the TI and construct scatter plots from the data. They identify properties of a scatterplot.
Curated OER
Elements of a Short Story
Young scholars analyze elements of a short story by working together. In this literature lesson plan, students analyze short stories. They use the TI Navigator Application to write their findings.
Alabama Learning Exchange
Complex Numbers Solutions
Complex doesn't have to mean harder! Learners experiment with online software to determine the quadratic equations with complex solutions. They use the quadratic formula to solve equations with both real and complex solutions.
Santa Barbara City College
How to Make a Multiplication Table
Teach children how to make a multiplication table, and they'll be multiplying for life. Following this series of steps, young mathematicians learn to use patterns and the relationships between numbers to create their very own...
101 Questions
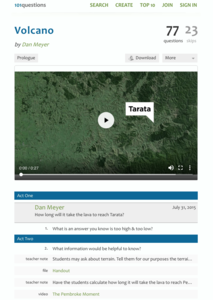
Volcano
This resource will blow your mind! Young mathematicians estimate the rate of volcanic lava flow by watching a video. They apply the rate formula to determine how long it would take the lava to reach a city. Let's hope everyone gets out...
Statistics Education Web
The Case of the Careless Zookeeper
Herbivores and carnivores just don't get along. Using a box of animal crackers, classes collect data about the injury status of herbivores and carnivores in the box. They complete the process of chi-square testing on the data from...
Statistics Education Web
It’s Elemental! Sampling from the Periodic Table
How random is random? Demonstrate the different random sampling methods using a hands-on activity. Pupils use various sampling techniques to choose a random sample of elements from the periodic table. They use the different samples to...


