NASA
Geographical Influences
"If global warming is real, why is it so cold?" Distinguishing the difference between weather and climate is important when it comes to understanding our planet. In these activities, young scientists look at the climate patterns in a...
Curated OER
Writing Equations of Parabolas in Vertex Form
Pupils use their knowledge of the vertex form of a quadratic equation to graph parabolas using a graphing calculator, given a specific move to make. this lesson may be used as a review or as extra practice, in groups or individually.
Curated OER
Application of Graph Theory
Students investigate different online tutorials as they study graphing. In this graphing lesson, students apply the concept of graphs cross curricular and use it to make predictions. They define the purpose and theories behind graphs.
Curated OER
Investigating Linear Equations Using Graphing Calculator
Young scholars investigate linear equations using the Ti-Calculator. For this algebra lesson, students graph lines and identify the different quadrants on a coordinate plane. They identify ordered pairs used to plot lines.
Curated OER
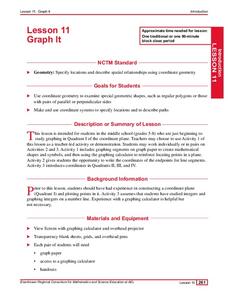
Graph It
Elementary and middle schoolers engage in a lesson of graphing in quadrant I of the coordinate plain. They use the graph to create shapes and symbols. While using a graphing calculator, they locate the points on the coordinate plane. In...
Curated OER
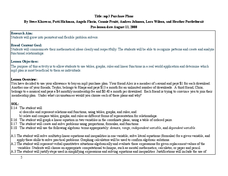
MP3 Purchase Plans
Use algebra to solve real world problems. Mathematicians practice use of graphs, tables, and linear functions to solve a problem regarding mp3 purchase plans. They work in groups to solve the problem and present their findings and...
Curated OER
M&M Graphing and Probability
Young scholars sort, classify, and graph M & M's. They create pictographs and bar graphs with the colors and numbers in each bag of M & M's. They calculate the ratio and probability based on class results.
EngageNY
Analyzing Residuals (Part 1)
Just how far off is the least squares line? Using a graphing calculator, individuals or pairs create residual plots in order to determine how well a best fit line models data. Three examples walk through the calculator procedure of...
Teach Engineering
Start Networking!
Class members create their own social networks by collecting signatures before graphing the interactions with their fellow classmates. The degree distribution of the simulated social network is determined by calculating the degree of...
Saxon
Plotting Functions
Youngsters use a graphing calculator to assist in creating a function table. They graph the function on a coordinate plane. They explore the relationship between the domain and range in the graph. This four-page worksheet contains two...
Curated OER
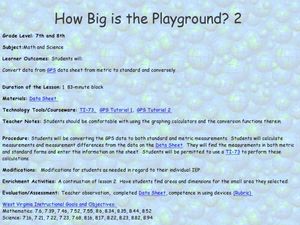
How Big Is The Playground?
Students calculate the standard and metric measurements of a playground. In this measurement lesson, students use GPS coordinates and graphing calculators to determine the dimensions of an area outside of the school in both standard and...
Flipped Math
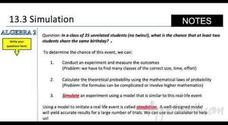
Simulations
Simulate an exciting graphing calculator-based lesson. Individuals watch and participate creating simulations using the random number generator in a graphing calculator to answer probability problems. Learners then build simulations to...
K20 LEARN
Driving Rationally: Introduction To Rational Functions And Asymptotes
Calculating average speeds is not as simple as finding an average. The lesson introduces class members to rational functions by presenting a problem about finding an average speed for the rest of a trip. Pupils develop an equation to...
EngageNY
Obstacles Resolved—A Surprising Result
The greater the degree, the more solutions to find! Individuals find the real solutions from a graph and use the Fundamental Theorem of Algebra to find the remaining factors.
Teach Engineering
Android Acceleration
Prepare to accelerate your Android. Pupils prep for the upcoming activity in this third installment of a four-part series. The lesson plan progresses nicely by first introducing different types of acceleration to the class. The teacher...
Utah Education Network (UEN)
Finding Slope of a Line from Graphs, Tables, and Ordered Pairs
Middle schoolers explore the concept of slope in numerous ways and start to look at simple linear equations. They describe the slope in a variety of ways such as the steepness of a line, developing a ratio, using graphs, using similar...
Mathalicious
Domino Effect
Carryout the lesson plan to determine the cost of pizza toppings from a Domino's Pizza® website while creating a linear model. Learners look through real data—and even create their own pizza—to determine the cost of each topping....
Curated OER
Cryptography on the TI-83 Graphing Calculator
High schoolers explore the history of cryptography. They assess function notation and transformation, matrix operations, and the fundamentals of modular arithmetic. Using graphing calculators, students develop their own encryption...
Curated OER
Wacky Water World: Student Worksheet
In this math worksheet, students will work alone or in pairs to determine which theme park ticket package is a better deal. Students will use data provided in the worksheet and a graphing calculator to make the decision.
Curated OER
Get a Half-Life!: Student Worksheet
In this math/science worksheet, students will work in pairs to conduct an experiment based on a decay function which is often used to model radioactive decay. Students will shake M & M's in a cup to rub off the M and then record...
Curated OER
Statistical Analysis For Graphing Calculators
Students analyze date from the Chesapeake Bay. Using a graphing calculator, they enter the data, plot three temperatures, and create a Box and Whisker plot.
Curated OER
The "U's" Have IT!
Students explore the maximum and minimum values of parabola. In this exponential equations lesson, students use graphing calculators or TI Interactive Software to calculate values of parabola and graph x-intercepts of parabola.
Curated OER
Graphing Systems of Inequalities
Solve equations and graph systems of inequalities. Designed as a lesson to reinforce these concepts, learners revisit shading and boundaries along with solving linear inequalities.
EngageNY
Translating Graphs of Functions
If you know one, you know them all! Parent functions all handle translations the same. This lesson examines the quadratic, absolute value, and square root functions. Pupils discover the similarities in the behavior of the graphs when...


