Curated OER
Range and Mode
Students interpret data from graphs. In this range and mode lesson, students review a tally chart, pictograph and bar graph. Students use these graphs to calculate the range and mode of each set of data.
Curated OER
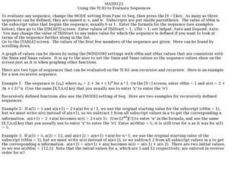
Using the TI-83 to Evaluate Sequences
In this evaluating sequences activity, students use the TI-83 graphing calculator to evaluate sequences. Instructions on how to use the calculator with these type of problems is provided. There are three problems on this one-page...
Curated OER
Polar Equations
In this precalculus worksheet, students find the solutions to polar equations for the 3 detailed problems using the coordinates and graphing calculators.
Curated OER
Investigating Transformations Of Parent Functions
Students identify the basic transformations of parent functions. They use their graphing calculator to create a transformation booklet by folding a sheet of computer paper in half and stapling along the folded edge.
Curated OER
Statistical Calculations Using M&Ms
In this frequency worksheet, students investigate, frequency, box plots, and percentage using a package of M&Ms. Copies of the actual correspondences with the Mars company are also included.
Curated OER
Exploring Linear Equations
Eighth graders follow the teacher as they enter information into the graphing calculator. They investigate different graphs to explain the slope of a line, the y intercept, and parallel lines.
Curated OER
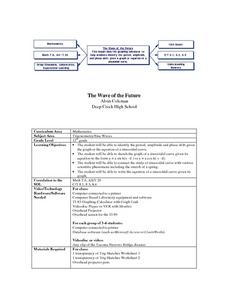
The Wave of the Future
Twelfth graders discuss sine curves and enter equations into their graphing calculator then compare different graphs created on their calculators. They identify the period, amplitude and phase shift given the graph or the equation of a...
Curated OER
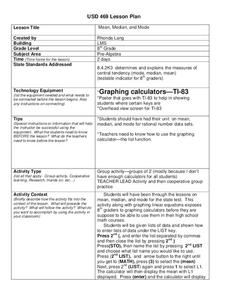
Mean, Median, and Mode
Eighth graders practice using the LIST key on graphing calculators using the proper syntax. They work with the functions of mean, median, and mode in a teacher led lesson and then with a partner on a second data set. They follow...
Lane Community College
Review Sheets: Geometry
Full of problems with polygons, angles, lines, and triangles, your learners get a multi-page packet that provides all they need to know. It contains many of the standard problem types as well as some more challenging questions.
Curated OER
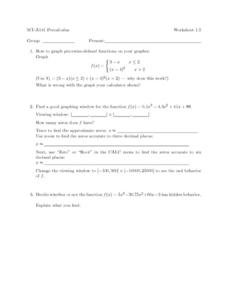
Worksheet 1.5: MT-141 Precalculus
In this precalculus worksheet, learners use their graphing calculator to graph functions. They explore and explain the graph of each function. Students manipulate the calculator to find answers to six decimal places.
Curated OER
Worksheet #2.6: MT-A141 PreCalculus
In this graphing instructional activity, students predict how a graph of given functions will work. Next, they check their work using a graphing calculator. Students use algebra to complete the graph of a square and determine...
Curated OER
Slope
Students calculate the slope of a line. In this slope lesson, students use a graph, an equation or two points to help them calculate the slope of a line. They differentiate between a slope of zero and an undefined slope.
Curated OER
Oodles of Poodles
Students solve equations by graphing. In this algebra lesson, students differentiate between functions and relations. They use the TI to graph their equation and analyze the graph.
Curated OER
Introduction to Tangent Lines using the TI-Nspire
Learners make mathematical argument using the concept of Limit. In this algebra lesson, student calculate the instantaneous rate of change from the linear graph. They use a TI-calculator to create a visual of the graphs.
Curated OER
Solving Systems: Inequalities
In this solving systems worksheet, students solve and sketch 13 systems of inequalities with a calculator and/or graph paper. Students then write 2 systems of inequalities for two graphs
Curated OER
Linear Approximation
In this algebra worksheet, students solve problems using estimation and the derivative. They calculate the critical points, domain and indicated intervals. They calculate the first and second derivative. There are 5 problems.
Curated OER
Sequence Investigation
Eleventh graders investigate arithmetic sequences. In this Algebra II lesson, 11th graders create an arithmetic sequence and explore the effect of each variable in the formula of the nth term of an arithmetic sequence. Students graph...
Curated OER
Analytic Geometry
In this analytic geometry worksheet, 9th graders graph and solve 13 different types of problems that include determining whether equations are linear to matching given equations to their corresponding equation in the second column....
Curated OER
Finding the Area Under A Curve with Random Probability
Students explore the concept of area under a curve. In this area under a curve lesson, students find the area under a curve using the Monte Carlo method using random points and probability. Students calculate the area under the same...
Curated OER
Mean Meadian and Mode
Students apply central tendencies to given data. In this statistics lesson, students calculate the mean, median, and mode as it relates to their data. They collect data and graph it while identifying the way the numbers are ordered.
Curated OER
Calculus Practice BC
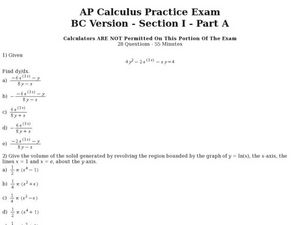
In this calculus worksheet, students solve functions using the derivatives. They calculate the volume where the graph is revolving around the x-axis, a line, the y-axis and where x=e. There are 28 questions.
Curated OER
Paying for Crime
Students participate in activties examining ratios and proportions. They use graphs to interpret data showing the government's budget for prisons. They present what they have learned to the class.
Curated OER
Slopes and Linear Equations
Students find the slopes of linear functions. In this graphing lesson, students analyze linear equations and calculate the slope of the line. They graph a line given the slope and y-intercept.
Curated OER
Derivatives and Maximum or Minimum
In this calculus worksheet, students calculate the maximum, minimum, and determine if the graph is concave up or down. There are 2 questions.


