Curated OER
Function or Not a Function
Graphing linear equations on the TI is easy! Through examination of graphs and identification if it is a function or not, this lesson can relate to the real world.
Curated OER
Systems of Linear Inequalities
The class solves systems of linear inequalities. They graph lines and identify the point of intersection.They graph lines and identify the boundary that represent the solution and solution set.
Curated OER
Derivative Analysis
Students analyze the derivative of a graph. In this calculus instructional activity, students identify the different behavior of a graph. They label concavity of the graphs as increasing or decreasing.
Curated OER
Slow Down - Speed Up
Pupils explore the concept of distance and time as they use a CBR to mimic distance v. time graphs. Learners walk towards and away from the monitor to create various distance v. time graphs, then discuss what motion creates certain graphs.
Curated OER
Approaching Limits
With the assistance of their Ti-84/Ti-83 Plus calculators, students develop a foundation for the limiting process as well as estimate limits from graphs and tables of values. They view how a function behaves as the input approaches a...
Curated OER
Rate of Change
Students observe and calculate slopes. In this algebra lesson, students graph equations and determine the pace at which the slope is changing. They use the navigator to see the change as they graph the lines around.
Curated OER
Cell Phone Range
Here is a 15 minute activity that can be used as review, a warm, or as a quick example of how to relate functions to the real world. Learners complete an application activity and draw conclusion about functions then discuss open and...
Curated OER
What is Log?
Young mathematicians differentiate between logs and natural logs in this algebra lesson. They solve functions and logarithmic functions. Learners also graph and rewrite the exponential and log functions.
Curated OER
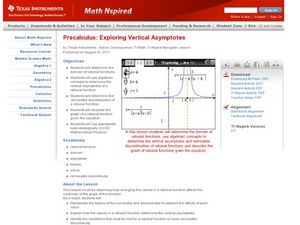
Exploring Vertical Asymptotes
Scholars identify the domain of a rational function in this precalculus lesson plan. They identify the removable discontinuity and label what will make the denominator zero. Learners also describe properties of the graph as it relates to...
Texas Instruments
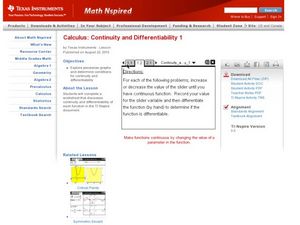
Continuity and Differentiability 1
Pupils examine graphs for continuity and differentiability in this calculus instructional activity. They observe piecewise functions to see where continuity and differentiability come into play. Learners finish by graphing their equation...
Curated OER
Riemann Rectangle Errors
High schoolers calculate the area under a curve. In this calculus instructional activity, students integrate the function to find the area under the curve. They use the Ti to create a visual of the graph.
Curated OER
Exponential Functions and the Natural Logarithm
Students solve exponential and log functions. In this algebra lesson plan, students graph natural log and logarithmic functions. They compare and contrast between logs and the exponential graphs.
Curated OER
Comparing Linear and Exponential Functions
Teach your class how to differentiate between linear and exponential functions. They use exponential properties to solve problems, graph them using the TI-Navigator, and make comparisons.
Curated OER
Solving Logarithmic Equations
High schoolers solve logarithmic equations. They graph and plot logarithmic functions and use algebraic steps and the calculator to simplify and solve the equations.
Curated OER
Piecewise Linear Integral
Young mathematicians solve and graph piecewise functions in this calculus lesson. They integrate linear functions containing restrictions and graph their answers using the TI.
Curated OER
Power Function Inverses
Pupils graph polynomial functions and analyze the graphs. They identify the inverse of the functions and find the domain and range. Learners will then label the functions as one to one and use the horizontal and vertical line test to...
Curated OER
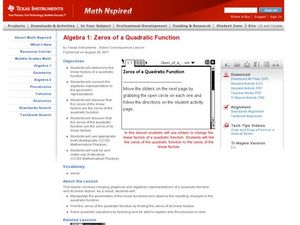
Zeros of a Quadratic Function
Factor quadratic equations by teaching your students how to identify the zeros of the quadratic function. They use the TI to see where the graph will intercept the coordinate plane.
Curated OER
Walk the Line
Learners create constant speed versus motion graphs. They will perform linear regressions on their data to describe the graphs mathematically.
Curated OER
Multiplying Monomials
High schoolers differentiate between linear and quadratic functions. In this algebra activity, students write equations of graphs and graph a function from an equation. They also identify the slope and y-intercept.
Curated OER
The Quest for Roots of Higher Order Equations
Young mathematicians explore the concept of solutions to higher order equations as they find roots of polynomials of degree three or higher. They also use the zero function on the Ti-83 to locate zeros of polynomials on a graph.
Curated OER
Cramer's Rule ID: 8793
Mathematicians are introduced to Cramer’s Rule and use it to solve three systems that have one solution, no solutions, and an infinite number of solutions. High schoolers use TI-Nspire to graph the systems to verify their answers...
Curated OER
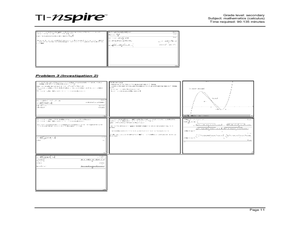
Two Investigations of Cubic Functions
Through learning about cubic functions, students graph cubic functions on their calculator. Students determine the local maximum and minimum points and the tangent line from the x-intercept to a point on the cubic function. ...
Texas Instruments
Minimums, Maximums and Zeroes
Young mathematicians will identify the minimum, maximum-and zeros of a function in this calculus lesson. They relate the derivative of a function to its zeros and minimum or maximum. They then graph their solutions and explain different...
Curated OER
Definite Integral
Learners investigate the intervals represented by a function in this calculus lesson. They decide what interval of the function will be positive, negative or zero. They are then given graphs of functions and asked to analyze it.
