Hi, what do you want to do?
Sophia Learning
Sophia: Using Graphs to Analyze Data
This lesson will demonstrate how to analyze and interpret data given in the form of a graph.
National Council of Teachers of Mathematics
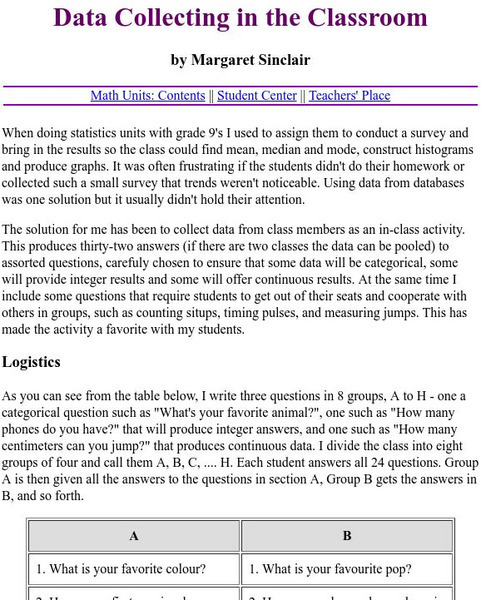
The Math Forum: Data Collecting in the Classroom
A list of two dozen questions students can easily ask eachother in the classroom to quickly collect data in hopes of using it in their study of making graphs. Some are opinion questions, while others require the counting of certain items...
Beacon Learning Center
Beacon Learning Center: All That Data
Students analyze data by finding the mean, median, mode, and range of a set of numbers. Line plots, bar graphs, and circle graphs are also included in this lesson.
Beacon Learning Center
Beacon Learning Center: All That Data 2
Students describe graphs and explore range, measures of central tendency, and distribution in this interactive web lesson.
Other
Tulpehocken Area School District: Graphing and Analyzing Scientific Data
Student worksheet with explanation of pie, bar, and line graphs, the parts of a graph, and the definition of mean, median, and mode. This summary is followed by an exercise for each type of graph within a scientific context.
Beacon Learning Center
Beacon Learning Center: Push Ups
This is a tutorial on line graphs including when, how, and why one might choose to use them and how to interpret the data when it is complete. This one is to reach a goal for the number of push ups needed to win the Presidential Fitness...
McGraw Hill
Glencoe: Self Check Quizzes 2 Making Predictions
Use Glencoe's Math Course 2 randomly generated self-checking quiz to test your knowledge of using data to make predictions. Each question has a "Hint" link to help. Choose the correct answer for each problem. At the bottom of the page...
Education Place
Houghton Mifflin: Eduplace: Make a Living Bar Graph
Student use simple data to line up in a living bar graph activity when they respond to simple questions in this lesson plan. They physically and visually represent the data. CCSS.Math.Content.3.MD.B.3 Draw a scaled picture graph and a...
Khan Academy
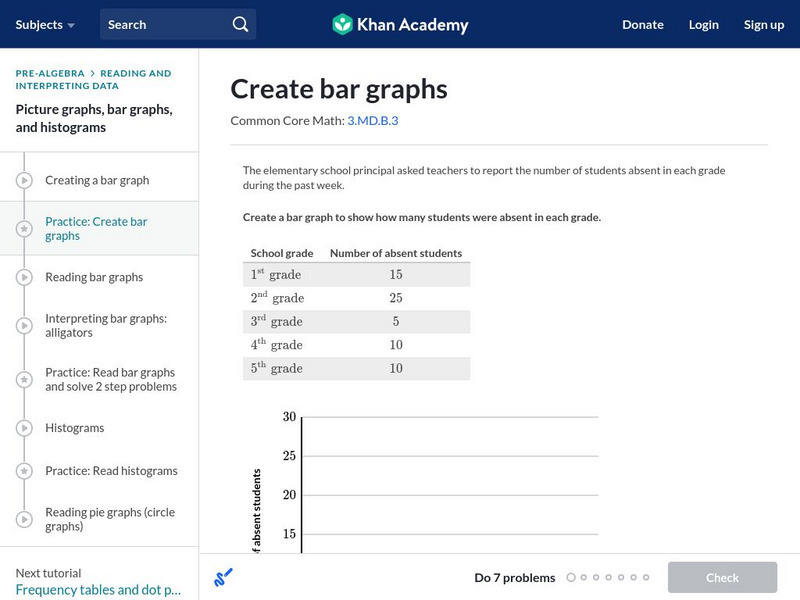
Khan Academy: Create Bar Graphs
Create a bar graph with the data given. Students receive immediate feedback and have the opportunity to try questions repeatedly, watch a video tutorial, or receive hints about creating bar graphs. CCSS.Math.Content.3.MD.B.3 Draw a...
PBS
Pbs Learning Media: Graphs, Charts, and Tables: Targeted Math Instruction
At the end of this lesson about graphs, charts, and tables, students will be able to interpret and compare data from graphs (including circle, bar, and line graphs), charts, and tables.
Better Lesson
Better Lesson: Line Graph Activity
Data collected is represented in tables and the students will need to choose what they want to represent in their line graph.
Rice University
Rice University: The Hand Squeeze
Students will enjoy this data collection and class analysis experiment involving the time it takes for a hand squeeze to travel around a circle of people. From organizing the activity to collecting the data to making a table and graphing...
Khan Academy
Khan Academy: Bar Graphs Review
Bar graphs are a nice way to visualize categorical data. This article reviews how to create and read bar graphs.
Other
Science Fair Primer: Reporting the Results
A good explanation of the elements of a good science fair report written by a high school science teacher. Details are given step by step on stating the hypothesis, explaining the experimental procedure, presenting the data attained, and...
Khan Academy
Khan Academy: Solve Problems With Picture Graphs 1
Read and interpret picture graphs. Students receive immediate feedback and have the opportunity to try questions repeatedly, watch a tutorial video, or receive hints.
Better Lesson
Better Lesson: What Is Your Favorite Pet?
SWBAT create a bar graph to match a data set. SWBAT analyze the graph to find 3 pieces of information the graph shows them.
Better Lesson
Better Lesson: What Is Your Favorite Little Bear Story?
SWBAT create a bar graph to match a data set. SWBAT analyze the graph for 3 pieces of information.
Better Lesson
Better Lesson: Greedy Gordy Can't Decide Working With Venn Diagrams
Students have been working with pictographs and bar graphs. Now they take their learning a step further by working with Venn Diagrams.
PBS
Pbs: Toothpicks: Patterns in Geometric Shapes
How can you describe the pattern made by a growing triangular shape? This interactive exercise focuses on using what you know about pattern recognition and completing a table so you have data you can use to graph the coordinates on a...


