Curated OER
Graphing Speed; Slope
For this graphing speed worksheet, students find the slope in a position vs. time graph to be the speed. They are given example graphs of position vs. time to show the changes in slope reflect the changes in speed. Students match terms...
Curated OER
Is there Treasure in Trash?
More people, more garbage! Young environmentalists graph population growth against the amount of garbage generated per year and find a linear model that best fits the data. This is an older resource that could benefit from more recent...
Curated OER
Velocity and Acceleration
Compliment your physics lesson with this PowerPoint which demonstrates many important points regarding acceleration and velocity. A starter experiment activity to stimulate student thinking is given, and may prove very interesting to a...
Curated OER
Scientists Track the Rising Tide
In this tracking the rising tide worksheet, students use the data in a graph showing the seal level change versus time from 1900 to 2000 to answer 3 questions about the rising tides. Students determine the slope of a line drawn from 1920...
Kenan Fellows
Density
Most scholars associate density with floating, but how do scientists determine the exact density of an unknown liquid? The third lesson in a seven-part series challenges scholars to find the mass and volume of two unknown liquids. Each...
Curated OER
Graphing Linear Motion
For this graphing linear motion worksheet, students answer 20 questions about velocity of objects, the distance they travel and the time. They interpret a graph of position vs. time and identify the velocity at certain point on the graph.
Curated OER
Graphing Data from the Chemistry Laboratory
Students graph and analyze data using a spreadsheet.
Bowels Physics
Graphical Analysis
Assist your class in learning graphical analysis by reviewing the slide presentation. Class members review 15 slides to further understand concepts such as velocity and acceleration. They conclude with practice problems related to the...
Curated OER
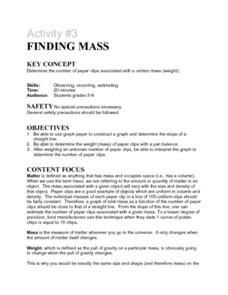
Activity #3 Finding Mass
Students use graph paper to construct a graph and determine the slope of a straight line. They determine the weight (mass) of paper clips with a pan balance. Pupils weigh an unknown number of paper clips, and to interpret the graph to...
Curated OER
Viewing Tubes
Students complete a lab in order to discover if the length of a viewing tube, its diameter, or the distance from an object affect the type of data collected and the resulting graph.
Curated OER
Walking Home II
Students explore the relationship between distance and time. They analyze a situation involving distance traveled in a given period of time, represent the situation graphically and algebraically, and discuss the concept of slope as a...
Curated OER
The Big Bang-Hubble's Law
In this Hubble's law worksheet, students use data for galaxies which include their distance and speed. Students make a graph to show the distance to each galaxy and the speed of each galaxy. They use their graph to answer 4 questions...
Curated OER
Exploring The Depths!
Fifth graders make a model of the ocean floor. In this ocean characteristics lesson plan, 5th graders complete a KWL chart about the ocean floor, use the Ocean Depth Data Sheet to create a graph, and create a 3-D model of the ocean...
Curated OER
Latent Heat of Fusion
Students conduct a series of investigation on latent heat of fusion. In this chemistry instructional activity, students explain how thermal storage systems work. They draw and interpret graphs.
Curated OER
Linear Motion 3
In this linear motion worksheet, learners answer 11 questions including finding acceleration of moving objects, finding the distance objects travel and finding the time it takes objects to move a particular distance. Students interpret...
Curated OER
Describing the Motion of a Battery Powered Cars
Students explore distance a toy car travels by changing the amount of batteries used to power the toy car. In this force and motion lesson, students calculate the average speed of a car while investigating the power from various...
CK-12 Foundation
Ck 12: Graphing
[Free Registration/Login may be required to access all resource tools.] Given a set of data, students will understand how to correctly draw a line or bar graph, interpret its patterns, and find the slope in the case of a line graph.


