Curated OER
Using Computers for Statistical Analysis of Weather
High schoolers use temperature, cloud cover and other weather data from the S'COOL website to statistically analyze weather around the country. They use computers to calculate and graph standard deviations, means and modes of the...
Curated OER
Weather Wonderland
Second graders explore the types of tools that scientists use t o study weater,
Curated OER
Creating Climographs
Students chart statistical information on graphs, interpret the information and use it to explain spatial relationships, and identify the relationship between climate and vegetation.
Curated OER
Soda Sales
Students are shown how to chart a supply demand curve, analyze information from a chart and send and receive information to participating schools by use of telecommunications (an added objective could be for fund-raising). They determine...
Curated OER
The Air Up There!
Students create a model of a column of air and discover one of the reasons why low and high pressure systems exist and why low pressure is often associated with bad weather.
Curated OER
The Air Up There
Students engage in a lesson that is concerned with the average daily weather patterns. They collect data over a five day period and then write a summary of the observations made from it. Students record the mean and graph it on a simple...
Curated OER
Tracking Temperature
Students investigate the concept of temperature and how it has the tendency to fluctuate. They record the temperature as a class on a daily basis for a long period of time. The data is charted and then at a designated time students...
Curated OER
Temperature High and Lows
Students gather high and low temperature readings through email. In this temperature graphing lesson, students use a spreadsheet to input data for a graph. students interpret the graphs to compare and contrast the data from different...
Curated OER
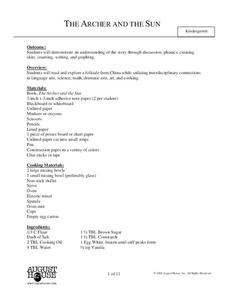
The Archer and the Sun
Students listen to The Archer and the Sun and participate in interdisciplinary activities related to the book. In this Archer and the Sun instructional activity, students discuss sun and weather and create a graph of the weather they...
Curated OER
Flight of Angles of Inclination
Students measure the flight of a gilder. In this fight of angles instructional activity, students explore the flight of a glider and measure the distance flown. They collect statistical data of the flights and determine the slope of...
Curated OER
Propaganda & Persuasive Techniques: Do You Buy It?
Fifth graders investigate the basic persuasive techniques employed in advertising. They identify three examples of propaganda/persuasive techniques, complete an observation chart, take an advertising quiz, complete a spreadsheet that...
Curated OER
Hypothermia: Temperature Changes Under Varying Conditions
Students conduct an experiment to determine what type of clothing would be most suitable for outdoor activities. They determine the temperature changes of the skin under various wet clothing materials and graph the temperature changes. ...
Curated OER
Filling Up
In this filling up worksheet, young scholars calculate the E85 per gasoline-gallon equivalent price to the E85 price per gallon to complete a chart of "alternative fuel". They use the data along with the price per gallon of gasoline to...
Curated OER
Seasons
Pupils explore the four seasons. Through observation activities, they explore and discuss the weather changes that occur during each season. Students create a graph of the clothing that is worn during each season.
Curated OER
Science: When Autumn Leaves Fall
Students conduct Internet research to discover the reason why leaves change color in autumn. On a nature walk around school grounds, they collect leaves of various colors and shapes over a three-week period. finally, students select...
Curated OER
Probability With a Random Drawing
Students define probability, and predict, record, and discuss outcomes from a random drawing, then identify most likely and least likely outcomes. They conduct a random drawing, record the data on a data chart, analyze the data, and...
Curated OER
Using Non-Text Features
Second graders examine graphs and charts from their local newspaper. As a class, they discuss what the data means and how it relates to the article. In groups, they are shown two sets of graphs or charts and they practice explaining...
Curated OER
Using a Thermometer
First graders use their senses to formulate questions and make predictions to determine what is in the "Wonder Bag". They hold pieces of ice and examine while listing descriptors on a chart and then take their own temperature using an...
Curated OER
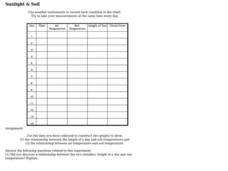
Sunlight & Soil
In this earth science worksheet on sunlight and soil, students use data collected in a chart to construct two graphs. Following, they answer five questions as they relate to the experiment performed.
Curated OER
Mapping a Temperature Field
Students measure and graph temperatures. In this temperature field lesson students use a map to measure and plot field values and construct isolines and interpret the results.
Curated OER
Celebrating the Solstice and Equinox
Fourth graders graph the number of daylight hors throughout the year and examine why day length varies. They discover that seasonal changes and latitude on Earth affect the number of hours of daylight in each day. Students listen to...
Curated OER
School Temperatures
Young scholars collect and record temperatures throughout the school. Using this information they compare and contrast the temperatures recorded from various spots throughout the school.
Curated OER
Sky Watching
Students trace how weather patterns generally move from west to east in the United States.
Curated OER
Temperature Comparisons
Students practice plotting temperature data points on a line graph in groups and examine the temperature differences at the same time of year. They graph the temperatures in Lannon, WI, and Mitchell's Plain, SA. After the data has been...


