Curated OER
Daily Weather Calendar
Third graders use the internet to record the daily weather conditions. Using symbols, they take the information they gathered and create an easy to read chart. They share their charts with the class to end the instructional activity.
Curated OER
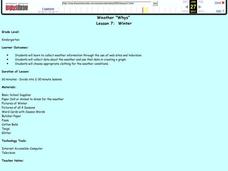
Weather "Whys"
Students complete activities to explore fall weather. In this weather lesson, students use the given links to examine weather forecasts. Students complete a weather graph activity and watch Internet field trips. Students complete fall...
Curated OER
Weather "Whys"
Students explore the weather. In this weather data activity, students collect weather data from Internet and media sources. Students graph the collected data discuss it as well as the seasons of the year.
Curated OER
Temperature Bar Graph
Students explore mean, median and mode. In this math lesson, students analyze temperature data and figure the mean, median, and mode of the data. Students graph the data in a bar graph.
Curated OER
Graphs
Pupils participate in a lesson plan exploring the concept of using graphs in various types of mathematical problems. They use negative and positive numbers in order to plot a graph. Students should use a place value chart for a reference...
Curated OER
Settlement Exploration: Then and Now
NASA has crafted an imaginative and memorable series of lessons, "NASA and Jamestown Education Module." This lesson is one of the five components. In it, middle schoolers connect history and science by comparing the settlement of...
Curated OER
Make a Bar Graph
In this bar graphs learning exercise, students use the tally chart to make a bar graph. Students color one box for each tally mark and then use the chart to help answer the questions about the sunny, cloudy, and rainy days.
Curated OER
Graphing and Analyzing Biome Data
Students explore biome data. In this world geography and weather data analysis lesson, students record data about weather conditions in North Carolina, Las Vegas, and Brazil. Students convert Fahrenheit degrees to Celsius degrees and use...
Curated OER
What's The Weather?
Second graders record and summarize daily weather observations for a week in the form of a bar graph. They cut and glue a weather symbol for each day, record it on the graph, and answer discussion questions.
Curated OER
Weather
Students participate in a variety of mini-lessons including experiments, literature readings, physical education components, music, data gathering and recording and more to expose them to several themes of weather; i.e. water cycle,...
Curated OER
Weather "Whys" Lesson 4: Spring
Pupils explore the attributes of spring. In this weather lesson, students collect data regarding weather from various media. Pupils graph simple weather data and dress animals for forecasted weather. Students discuss the characteristics...
Curated OER
Weather Graphs
First graders use their knowledge of weather symbols to organize and construct a graph of the daily weather for one month. Each student have a chance to give the daily weather report using Sammy's Science House Computer Software.
Curated OER
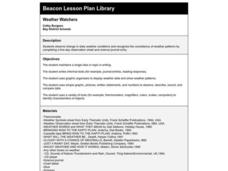
Weather Watchers
First graders study changes in daily weather conditions. They explore weather pattern consistency.
Curated OER
Weather Patterns
Fourth graders collect and chart weather data over the course of the school year either using tools at school or media resources. They agree on weather terms to use in their observations and write them on the assigned sheet. Finally,...
Curated OER
Weather: Like It or Not!
Second graders investigate daily weather changes. For this earth science lesson, 2nd graders identify the different terms used to describe weather. They use the outdoor thermometer to record data.
Curated OER
Under the Weather
Students review mean, median, mode, and range while using the newspaper to answer weather questions.
Curated OER
Let the Weather Help You Dress
Students observe weather daily for at least a month and graph the weather for one month. Then they use weather vocabulary such as sunny, windy, rainy, stormy, cold, snowy, foggy, and hot, and share their predictions about weather. ...
Curated OER
Bar Graphs
Students perform operations and graph their data using charts and bar graphs. In this algebra lesson, students follow specific steps to make a bar graph. They create a survey about people favorite things and plot their data from the...
Curated OER
How's the Weather?
Students explore earth science by researching the Internet. In this weather pattern lesson, students utilize the website weather.com to analyze the weather in different geographic locations. Students view charts and graphs based on...
Curated OER
Weather Instrument Data Chart 2
In this science worksheet, high schoolers look for the data that is needed to fill in the graphic organizer. The prefixes are given that are needed to sort the information as it is collected.
Curated OER
Graph and Compare the Adventure's Temperature Vs. Local Temperature
Learners explore the concept graphing data. In this graphing data lesson, students use weather data from their local weather and some other city and graph them. Learners plot the local weather vs. another city. Students record...
Curated OER
Good Weather
For this graphing data worksheet, students complete a temperature chart and then answer two questions about the weather for that week.
Curated OER
Design Weather Instruments using LEGO Sensors
Learners design and create a LEGO structure that will house and protect a temperature sensor. They leave the structure in a safe spot and check the temperature regularly and chart it. After the students have built their structures, the...


