Curated OER
Speed and Distance
In this speed worksheet, students create time vs. distance graphs to answer questions about average speed, average velocity, and acceleration. This worksheet has 3 problems to solve.
Curated OER
Motion Graphs
In this motion graphs worksheet, learners learn about how motion of objects can be described using a graph. Students then answer 10 fill in the blank, 10 short answer, and 5 problems to solve.
Curated OER
Calculating Speed
Fourth graders complete an experiment on calculating speed. In this speed calculation lesson students complete an activity in which they have dominoes fall as slow as possible.
Curated OER
Speed and Experiments
In this speed formula and scientific method learning exercise, students read over descriptions of the formula an method. Students then respond to 12 matching, problem solving and short answer questions.
Curated OER
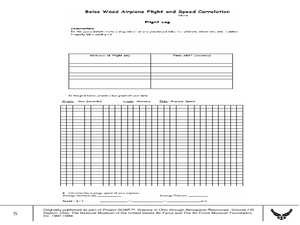
Balsa Wood Airplane Flight and Speed Correlation
Ninth graders calculate the average speed of their balsa wood airplane. In this physics lesson, 9th graders build their own airplane and make necessary modifications to to make it fly straight. They interpret distance and time graph...
Curated OER
Olympic Line Graphs
Sixth graders examine how to make line graphs. In this Olympic line graph lesson students make line graphs and search the given Internet sites to find data on their summer Olympic Game.
Curated OER
Motion of a Bowling Ball
Students experiment with distance, speed, and motion by graphing the motion of a bowling ball. In this distance versus time graphing lesson, students observe the speed and distance of a rolling ball and graph their findings. They then...
Curated OER
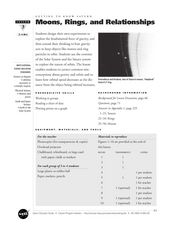
Getting to Know Saturn: Moons, Rings, and Relationships
Students identify the different objects that orbit Saturn. In this space science lesson, students plot the graph of orbital speed and distance. They explain why planets and asteroids remain in orbit around the sun.
Curated OER
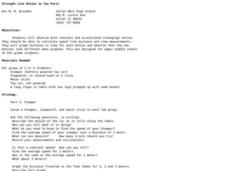
Straight Line Motion in Two Parts
Students describe and quantify the motion of toy cars. In this motion lesson plan, students observe a battery powered toy car on a flat surface and a standard toy car on a sloped surface. They write their observations, measure average...
Mr. E. Science
Motion
An informative presentation covers motion, metric system, conversions, graphing of coordinates and lines, speed, velocity, and acceleration problems, as well as mean calculations. This is the first lesson in a 26-part series.
CK-12 Foundation
Archery
Archery is believed to be one of the oldest sports in the world at more than 25,000 years old—meaning it can teach your classes a lot! Scholars learn about the forces interacting in the archery simulation. They control the archer's...
Curated OER
Find the Speed of a Protist
Young scholars identify protists under a microscope, and using a stopwatch calculate the speed of a protist from a pond water sample. They use distance and time to identify the speed of a protist, and create a distance versus time graph...
Curated OER
So Fast! So Slow!
Fifth graders give examples of objects that move slow and fast. In this physics instructional activity, 5th graders rank animals according to how quickly they move. They create a bar graph of organisms versus rates of speed.
Curated OER
Walking Home II
Students explore the relationship between distance and time. They analyze a situation involving distance traveled in a given period of time, represent the situation graphically and algebraically, and discuss the concept of slope as a...
Curated OER
How Does the Angle Effect How Fast a Car Will Travel?
For this angle of movement and speed worksheet, learners determine at which angle a car will travel the fastest. They test 12 different angles on a toy car and determine from their data which angle is the best for speed.
Curated OER
Graphing the Weather
Fourth graders predict the weather for their area using simple weather instruments. They take readings for a month during a season and graph their results. Students describe weather patterns based on their data and predict future weather...
Edmond Public Schools
8th Grade Science Resource Book: Unit 2 - Physics
Get things moving with this extensive collection of physical science resources. Covering the fundamentals of measurement, graphing, lab safety, and experimental design as well as the specific scientific concepts of velocity,...
Kenan Fellows
Introduction to a Flight Computer
Keep your hands on the wheel—at all times! Scholars learn why pilots use a flight computer through a high-flying demonstration. Making calculations for speed, distance, or time is automatic if you know how to use a flight computer.
Urbana School District
Sound
Beautiful music doesn't just write itself, but if you ever feel bad about procrastinating, remember that Mozart wrote the overture to Don Giovanni the morning it premiered. Introduce young scientists to the elements of sound including...
Curated OER
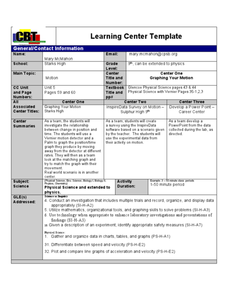
"Graphing Your Motion"
Students study the concepts of motion, velocity, and acceleration through graphing their own movement using LoggerPro. They explain the difference between speed and velocity using the weather vane example. They discover the difference...
Curated OER
Position and Velocity vs. Time Graphs
In this position and velocity worksheet, students sketch graphs of position vs. velocity and position vs. time for 6 problems given different scenarios. They label their graphs with given positions, velocities and times.
Curated OER
Tracking Speed
Young scholars collect data for a runner by measuring the time it takes for the runner to run equal distances. After collecting data, students average speeds and accelerations for the runner. Assignment is completed by graphing the data.
Curated OER
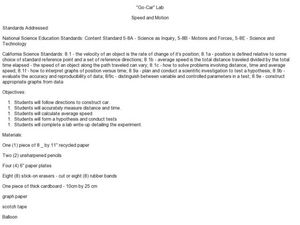
"Go-Car" Lab
Students construct a car based on directions given. For this physics lesson, students calculate average speed using distance and time information. They collect data and create a graph of distance vs. time.
Curated OER
Mathematical Techniques - Basic Graphing
Learners are introduced to significant figures and how to add, subtract, multiply and divide them. In a group, they practice plotting data points from a table to a graph and labeling all axes. They calculate the slope and y-intercept and...


