TeachEngineering
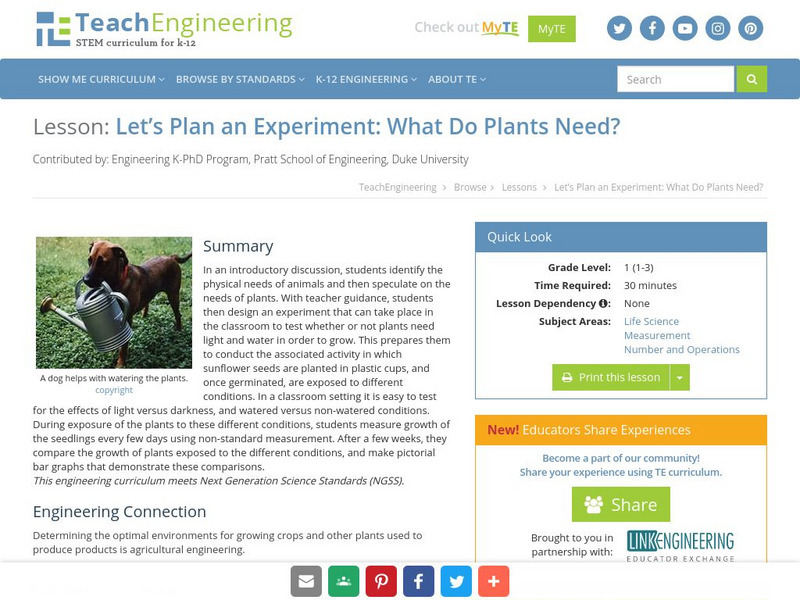
Teach Engineering: Who Needs What?
The teacher leads a discussion in which students identify the physical needs of animals, and then speculate on the needs of plants. With guidance from the teacher, the students then help design an experiment that can take place in the...
Climate Literacy
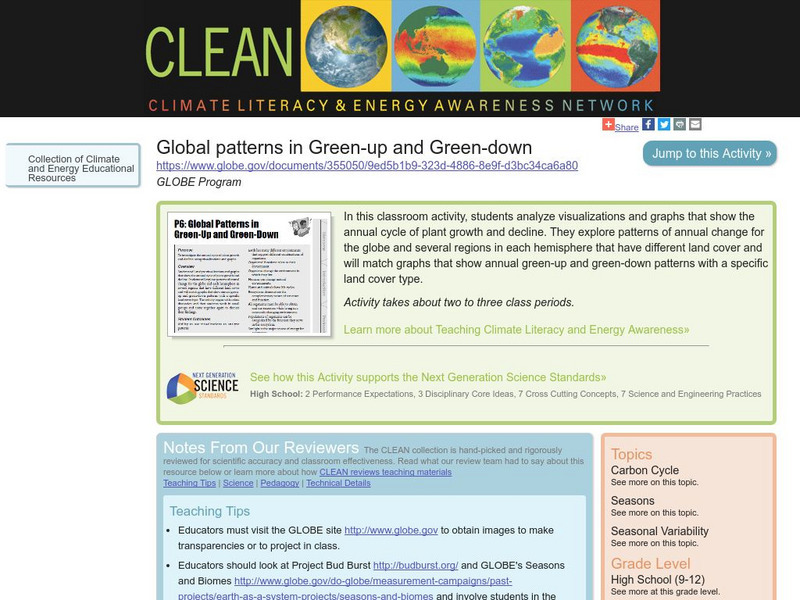
Clean: Global Patterns in Green Up and Green Down
Students analyze and explore visualizations and graphs that show the annual cycle of plant growth and decline. They investigate several regions in each hemisphere that have different land cover and will match graphs that show annual...
PBS
Pbs Teachers: Tree Mendous Plots [Pdf]
To teach students how to use collect and use real-life data, use this activity to create, populate and analyze graphs to interpret data related to the growth of plants from seeds. The activity then asks students to create a story about...
Climate Literacy
Clean: Temperature and Precipitation as Limiting Factors in Ecosystems
Students correlate graphs of vegetation vigor with those of temperature and precipitation data for four diverse ecosystems, ranging from those near the equator to the poles, to determine which climatic factor is limiting growth.


![Pbs Teachers: Tree Mendous Plots [Pdf] Lesson Plan Pbs Teachers: Tree Mendous Plots [Pdf] Lesson Plan](https://content.lessonplanet.com/knovation/original/114247-36948766618258b08210c17f84fd1d88.jpg?1661419217)
