A Mighty Girl
Gladys West
Teens might find it hard to imagine life before GPS. Using global positioning systems, they can quickly locate the nearest gas station, fast food establishment, or the home of a new friend. Introduce them to Gladys West, the lady who...
NASA
Nasa Earth Observatory: Global Maps: Total Rainfall
View a global map from NASA's Earth Observatory showing total rainfall from January 1998 to November 2008.
NASA
Nasa Earth Observatory: Global Maps: Net Radiation
View a global map from NASA's Earth Observatory that shows net radiation from July 2006 to November 2008. Learn about radiation and the balance between incoming and outgoing energy in the atmosphere.
NASA
Nasa Earth Observatory: Global Maps: Cloud Fraction
View a global map showing cloud fraction from January 2005 to November 2008. Learn how clouds have a warming and cooling influence depending on altitude.
NASA
Nasa Earth Observatory: Global Maps: Land Surface Temperature
View a global map from NASA's Earth Observatory that shows land surface temperature from February 2000 to November 2008. Learn how land surface temperature is measured and monitored.
Mocomi & Anibrain Digital Technologies
Mocomi: What Is Global Warming?
This slideshow presents a number of issues, including global warming vs. global dimming and the causes and possible solutions for both issues.
PBS
Pbs Learning Media: Global Warming: Graphs Tell the Story
Examine these graphs from the NOVA/ FRONTLINE Web site to see dramatic increases in the temperature of Earth's surface and greenhouse gases in the atmosphere.
Princeton University
Princeton University: Qed: Mapping Globalization: Map Category Queries
A large database of historical maps that can be searched by map type, time period (prehistory to 21st century), theme, and world location. Themes cover economics, war, disease, trade, migration, and much more.
University of Oregon
University of Oregon: Global Climate Animations
Check out this site for global climate animations. "Get a feel for why we have seasonal weather changes or why other regions have different weather than you do."
Global Problem Solvers
Gps: Global Problem Solvers : The Series Season 1: Working Well: Scripts
Global Problem Solvers is an animated STEM series from CISCO that features a group of middle school students who work together to solve social problems. This teacher's resource provides scripts for each Global Problem Solvers episode...
Global Problem Solvers
Gps: Global Problem Solvers: The Series Season 1: Working Well: Storyboards
Global Problem Solvers is an animated STEM series from CISCO that features a group of middle school students who work together to solve social problems. This teachers resource provides pictures and words that summarize each episode.
University of Illinois
University of Illinois: Early American Trade With China: Global Economy, 1775 [Pdf]
A PDF of a global map of the world economy in 1775.
NASA
Nasa Earth Observatory: Global Maps: Aerosol Optical Depth
View Earth's aerosol optical depth by watching a global map evolve from January 2005 to November 2008. Learn about aerosol amounts such as volcanic ash, sea salt, smoke, and other pollutants.
NASA
Nasa: Climate Time Machine
Travel through time and explore how the changing climate has affected sea ice, sea level, carbon dioxide levels, and global temperatures. Also, decide whether or not you would be affected if the sea level rose due to warmer temperatures...
NASA
Nasa Earth Observatory: Global Maps: Chlorophyll
Discover how chlorophyll is related to photosynthesis and watch a map evolve from July 2002 to October 2008 showing the varying levels of chlorophyll. Read about how important chlorophyll and photosynthesis are to our environment.
Sophia Learning
Sophia: Global Editing
This lesson introduces the concept of global editing. Students learn to edit for big picture ideas like organization, strategy, and effectiveness. W.9-10.5 Writing Process, W.11-12.5 Writing Process
Princeton University
Princeton University: Qed: Mapping Globalization: Maps
Several historical maps showing steamship routes around 1900, ancient world maps, and shipping routes and lines in 1912, including those that passed through the Panama Canal.
Other
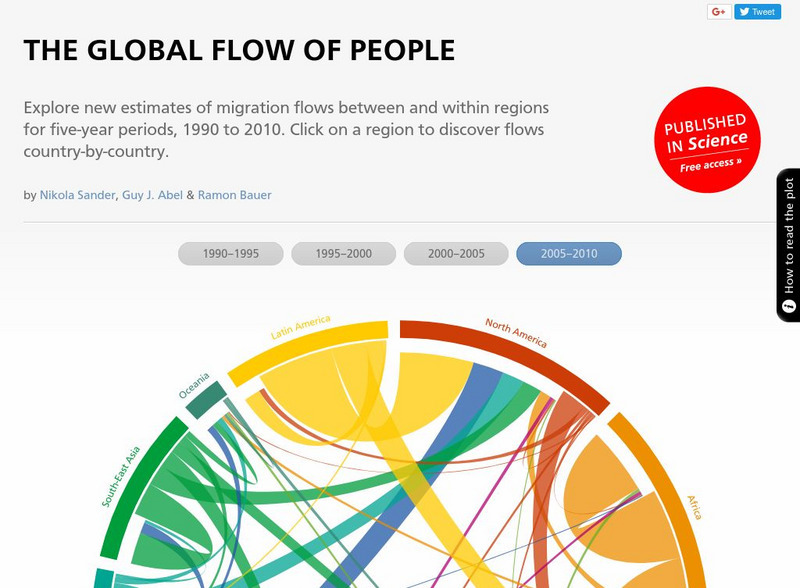
The Global Flow of People
Investigate estimates of migration flows between and within regions for five-year periods, 1990 to 2010. Click on a region to discover flows country-by-country.
Other
Jules Verne Voyager: Gem Global Strain Rate Map
GEM GSRM uses a texture underlay grid showing the 2nd invariant of lithospheric strain rate, with an image overlay of coastal outlines in white - which forces the texture underlay to have a black background in regions of zero strain...
National Center for Ecological Analysis and Synthesis, University of California Santa Barbara
University of California: A Global Map of Human Impacts to Marine Ecosystems
Maps in different categories such as fishing, climate change, and pollution were pulled together into a composite map that shows the impact of humans on the world's oceans. Analysis at the time (2008) showed that 40% of the world's...
Curated OER
Global Wind Pattern on the Earth Without an Ocean, Axiz Tilt, and Rotation.
Global wind pattern on the earth without an ocean, axiz tilt, and rotation.
Other
Gfdl: Temperature (F) Response Due to Increased Atmospheric Co2
An animated model of the Earth from the Geophysical Fluid Dynamics Laboratory showing how global temperatures increased from 1870 to 2100 due to rising amounts of carbon dioxide in the atmosphere.
Curated OER
Montage for the Global War on Terror
From the Veterans Memory Project a series of interviews with veterans of the Global war on Terror built around four themes; attitudes toward service and war,combat,re-entry to civilian life, and the impacts of the experience.
Curated OER
Science Kids: Science Images: Global Vegetation
This picture helps show global vegetation levels. Looking at the image it is clear to see that some areas are rich in vegetation while others are not. Vegetation levels are vital for humans living around the world, satellites monitor the...
Other popular searches
- Global Warming
- Global Climate Change
- Global Education
- Global Awareness
- Global Cultures
- Global Economics
- Global Issues
- Global Ecology
- Global Warming Worksheet
- Global History
- World Population
- Global Wind


