Curated OER
Circles Minilab
Students learn how to measure the diameter and circumference of a circle. In this circle activity, students organize their data to create a graph. Students utilize their graph to make an inference about the slope of pi.
Curated OER
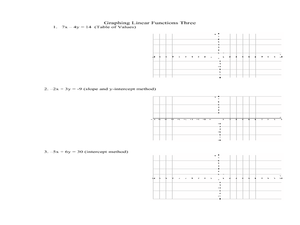
Graphing Linear Functions Three
In this algebra worksheet, learners are given an equation and asked to create a table of values and graph their equation. The other method they use for graphing is the slope intercept method, by solving the equation for y and identifying...
Curated OER
Graphing Linear Equations with Calculator
Students graph lines using the calculator. In this algebra lesson, students graph lines of equations in the form y=mx+b. They input equations into the TI Calculator and graph using the slope and intercept. They analyze the graph for...
Curated OER
Graphing Linear Equations on the TI
Students graph linear equations on the TI calculator. In this algebra lesson, students rewrite equations in the slope intercept form and use the calculator to graph their problem. They work together to interpret the graphs off of the TI.
Curated OER
More of U.S.
Explore graphical representation of a real-life data set and determine the exponential regression model for the data in your classroom. Students also compare the estimated value to the given value by determining the percent error.
Curated OER
Qualitative Analysis of the S-I-R Model
In this qualitative analysis worksheet, students explore the S-I-R model of determining given values of a function. They determine the maximum, minimum values and the slope. students write a rate equation for given information. This...
Curated OER
Solving Systems of Linear Equations Graphically
Students solve systems of equations graphically. For this algebra lesson, students find the point of intersection of two lines if they are not parallel. They rewrite the equation in the y=mx + b form and graph using slope and intercept.
Curated OER
Population Models and Qualitative Analysis, Part 2
In this population model instructional activity, students explore models of population growth using the Gompertz growth model and the exponential growth model. They sketch a graph of the slope function and determine possible solutions...
Curated OER
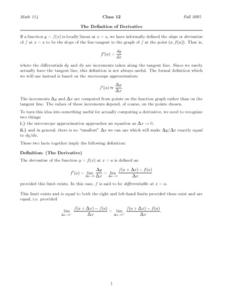
The Definition Derivative
In this derivative worksheet, students evaluate limits, factor equations, and calculate the given function. They determine the derivative of a function and plot it on a graph. This four-page worksheet contains eight problems.
Curated OER
Computing Derivatives
In this computing derivatives worksheet, students determine the derivative, slope, and rate of change in a function. They indicate if a function is constant, increasing, or decreasing. This two-page worksheet contains approximately ten...
Math Worksheet Center
Linear Quadratic Systems
In this linear quadratic system worksheet, learners explore a system with a linear and a quadratic equation. With the given equations, students graph the parabola. They identify the axis of symmetry, the slope, points of intersection,...
Curated OER
Monsters of the Deep
Students describe major features of cold seep communities and list the organisms that are typical in these communities. In this deep sea environment lesson students work in groups and research their given cold seep group.
Curated OER
Nine Quadrilateral Problems Involving Angle Measures and Classification
In this quadrilaterals worksheet, students calculate the measure of angles in five parallelograms, name a quadrilateral, and find values of given variables in three diagrams. The solutions are provided.
Curated OER
Graphing Real World Situations
Students solve linear equations using graphs. In this algebra instructional activity, students depict real life situation using lines and functions. They identify the slope, data and predict graphing behavior.
Curated OER
Environment: Inupiat Weather Expertise
Students investigate methods of weather prediction prior to modern communication sources. A local elder lectures the class on weather prediction and safety. They document the experience by creating posters. Applying methods given by the...
Curated OER
How Fast is "Fast"?
In this movement worksheet, students will complete 5 sentences by filling in the blank with vocabulary words associated with movement: acceleration, gravity, and speed. Then students will be given 3 units of measurement and they will...
Curated OER
Equation of a Line
In this equation of a line learning exercise, 9th graders solve and complete 7 different problems. First, they find all values of the constant k, if the line contains the given points. Then, students write an equation of the line which...
Curated OER
Linear and Nonlinear Functions
Students identify properties of a line. In this algebra lesson, students differentiate between functions and nonfunctions. They use the slope and y intercept to graph their lines.
Curated OER
Differential Equations
In this differential equations worksheet, students solve and complete 3 sets of various problems. First, they solve each of the differential equations. Then, students use the given information to evaluate the constant of integration....
Curated OER
Finding Comfort in an Unfamiliar Landscape
Students recognize the writings of a prominent American writer. They analyze written text making connections to personal prior experience. Students discuss in small and large groups their findings. They organize ideas in writing using...
Curated OER
Practice Exit Exam - Mat 0024
In this practice exit exam, students complete a variety of basic algebra problems on an Algebra I skill level. They simplify expressions containing variables, factor quadratic equations, find the slope of a line, identify the...
Curated OER
Plate Tectonic-Hazards
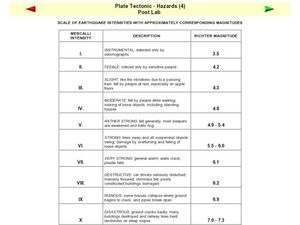
In this plate tectonics worksheet, students are given a table with the Mercalli intensity of earthquakes, a description of what happens at each intensity, and the Richter magnitude of the earthquakes.
Curated OER
Properties of Logarithms
Students explore the concept of logarithms. In this logarithms activity, students graph logarithms on their Ti-Nspire calculator. Students describe the shapes of their graphs by identifying slope, y-intercepts, and...
Curated OER
Phone Button Boggle
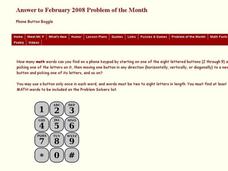
For this phone button boggle worksheet, students identify the number of math words they can find on a phone keypad according to given directions. This one-page worksheet contains one problem. Answers are provided.

