Curated OER
Trade Missions
Students research the products of countries in Central and South America. t research which products from the countries they represent are imported to the United States. They create tables and/or graphs to indicate annual totals.
Curated OER
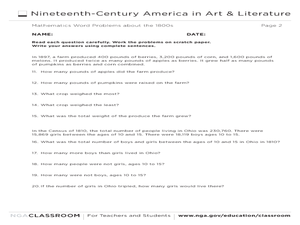
Mathematics Word Problems About the 1800s
In this history and math worksheet, students solve 20 problems pertaining to life in America in the 1800s. Students read four paragraphs and solve the five problems using that information. Basic math operations are used.
Curated OER
Places and Production
High schoolers calculate United States GDP and GDP per capita, use a choropleth map to acquire information, and create choropleth maps of GDP per capita in South America. They identify regions with high and low GDP per capita
Curated OER
Let's Go To Mexico
Students are able to use the Internet to conduct research. They research Mexican culture and traditions. Students compare and contrast Mexican and U.S. food and clothing. They convert United States currency to Mexican pesos. Students...
Curated OER
Follow That Ship!
Learners in this exercise are introduced to the distinct ways of measuring distance (nautical miles) and speed (knots) at sea, as well as the concepts of latitude and longitude for establishing location.
Curated OER
Places and Production
Students investigate the economy and the market value of goods. For this algebra lesson, students differentiate between domestic goods value and international good value. The define and identify the importance of GDP or Gross Domestic...
Curated OER
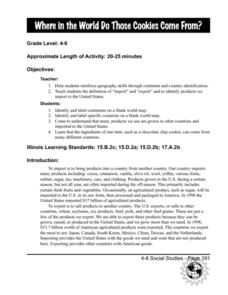
Where in the World Do Those Cookies Come From?
Learners discuss exports and imports by discovering where the ingredients come from for making chocolate chip cookies. They take a survey of their favorite cookies and create a bar graph to represent the information.
Curated OER
Water and Land 207
Students examine maps of different projections, mathematically calculate distortions, and note the advantages and disadvantages of each map. They study the different maps and transfer the map to graph paper.
Curated OER
Start with a Chart
Students use a given chart and the 50 state quarters to synthesize information about the 50 states and the dates that they were admitted into the union. Students complete a math worksheet while referring to the chart.


