Curated OER
Arc GIS Project: Visualizing the Holocaust
A cross-curricular lesson for middle schoolers that covers language arts, social studies, geography, and math, this is a great extension activity if your class is reading The Diary of Anne Frank or learning about the Holocaust. Using...
Curated OER
Teaching Modeling Water Quality
Young scholars explore the basics of interpreting RUSS temperature and oxygen profile data. They are introduced to the Geographic Information Systems (GIS), particularly with respect to interpreting maps.
Curated OER
How High Is That?
Students explore the National Spatial Reference System. In this vertical position lesson, students will discuss the use of vertical position data and solve practical problems involving geographic positioning.
Curated OER
Migration Mania
Students explore the migratory patterns of four different animals. Reasons for the migration and migratory distances are investigated in this lesson.
Curated OER
Matrix Analysis of Networks
Explore the connection between a finite graph, a directed graph, and a matrix. Graph lines and identify the relationship of matrices in real-world scenarios. Then use this information to work with a partner to plan and design a town...
Curated OER
Where Am I, and How Do I Get Where I am Going?
Students describe geographical places through art, music, writing, and math. They compile information in booklets which may be published.
Curated OER
The Census of Marine Life
Students explain diversity and abundance in marine life. For this oceanic biology lesson, students collect information for various geographical areas to collect a census of marine life.
Curated OER
Graphing and Analyzing Biome Data
Students explore biome data. In this world geography and weather data analysis lesson, students record data about weather conditions in North Carolina, Las Vegas, and Brazil. Students convert Fahrenheit degrees to Celsius degrees and use...
Curated OER
Is the Hudson River Too Salty to Drink?
Students explore reasons for varied salinity in bodies of water. In this geographical inquiry lesson, students use a variety of visual and written information including maps, data tables, and graphs, to form a hypothesis as to why the...
Curated OER
Biomimicry, Nature: Architecture of the Future
Students explore the relationship between nature and architecture. In this cross curriculum history, culture, and architecture lesson, students observe and discuss structures visible in nature. Students view websites in which Native...
Curated OER
The Grand Excursion GPS Map
Eighth graders investigate the uses of a global positioning system. They create waypoints and have to find them using the system. Students must review the geographical concepts of latitude and longitude. The media requirements of the...
Curated OER
"Adding It Up" at James Fort
Students discuss jettons and their archaeological importance at Jamestown. They then practice using historic counting sheets and artifacts to understand the calculating methods of the early 17th Century, and identify their similarities...
Curated OER
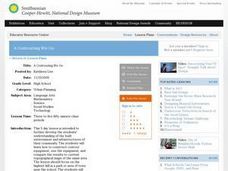
A Contouring We Go
Students examine the built environment and infrastructures of their community by constructing contour equipment, using the equipment, and comparing their results to current topographical maps of the same area
Curated OER
Mathematical Modeling
Study various types of mathematical models in this math lesson plan. Learners calculate the slope to determine the risk in a situation described. They respond to a number of questions and analyze their statistical data. Then, they...
Curated OER
Time Zone Math
In this algebra worksheet, students calculate the different time of the day that different countries see the sun. They convert between different time zones. There are 3 questions with an answer key.
Curated OER
Cartogram of the Great Compromise
Young scholars create cartograms of populations during 1790.
Curated OER
What Are We Going To Do About Baby Six Billion?
Students formulate and evaluate suggestions about government policy using demographic examples and projections. They examine websites and utilize worksheets imbedded in this plan.
Curated OER
Risk Assessment and Geometry
Tenth graders study the concept of risk analysis as it relates to geometry. In this spatial relationship instructional activity, 10th graders are provided a set of coordinates to analyze a piece of land described. Students write a...
Curated OER
Word Problems
Students use the "gist" strategy to understand how to dissect parts of a word problem. In this word problem lesson plan, students learn how to solve word problems and then solve them.
Curated OER
In the Wake of Columbus
Students explore how the population decreased in native cultures.
Curated OER
Home on the Range
Students use maps and mathematics to determine the appropriate panther population in a given area. In this Florida ecology lesson, students research the area requirements of male and female panther and use a map to help calculate how...
Curated OER
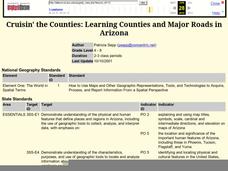
Cruisin' the Counties: Learning Counties and Major Roads in Arizona
Young scholars examine Arizona counties and use the themes of location and movement to develop an Arizona map.
Curated OER
Cookie Topography
Students construct a cross section diagram showing elevation changes on a "cookie island." Using a chocolate chip cookie for an island, they locate the highest point in centimeters on the cookie and create a scale in feet. After tracing...
Curated OER
Capital for Cookies
Fourth graders find the meaning for capital, land, labor and enterprise and relate them to economics of a place. In this economics lesson, 4th graders form a company to make an agricultural product and look for the resources they will...
Other popular searches
- Gis Data
- Gis Map
- Gis Software
- Gis Environment
- Gis and Gps Technology
- Gis Gps
- Gis and Remote Sensing
- Gis Data Map
- Geography, Gis
- Gis Lesson Plans
- Gps/gis
- Gis Water


