Hi, what do you want to do?
Curated OER
Changes Close To Home
Learners interview the senior citizens in their community. While interviewing them, they identify perceptions they have about the local climate. Using the internet, the compare the results of the interview to those of public thirty...
Curated OER
Flame Test
Students conduct a flame test on different substances. In this chemistry lesson, students predict the element present based on the color emitted during the flame test. They explain how different elements produce different colors.
Science Education Resource Center at Carleton College
Serc: Lab 3: Discovering Local Data
An investigation that is part of a series of lab lessons that expose students to Earth Systems through research, data, and visulazations. This lab specifically has students using a database to gather and graph data to understand the role...
Books in the Classroom
Carol Hurst's Children's Literature Site: Data Gathering and Analyzing
Carol Hurst provides this sample chapter from "Picturing Math." Gathering data is a frequent part of solving problems and satisfying curiosity, which includes working with graphs and using mathematical tools such as averaging and other...
PBS
Pbs Kids Afterschool Adventure!: Operation: All About Us Activity Plan
It's time to stand in the spotlight! During this Afterschool Adventure, children will learn about and practice a variety of math skills as they gather information about their favorite subject-themselves! Children will start out by...
Other
Delta State University: Lesson Plan 3: Pie Graphs
The students will gather, organize, and display data in an appropriate pie (circle) graph using M&M's! [PDF]
Better Lesson
Better Lesson: Foods Third Graders Like
Third graders gather simple data, represent it on a bar graph, and answer simple, complex, and open-ended questions about the data.
Science Education Resource Center at Carleton College
Serc: Discovering Velocity Outside of the Classroom
A physics lab activity where students gather data from classmates running at different rates on a football field. They then share their gathered data and transfer it to a graphing program to ultimately calculate average velocity.
Alabama Learning Exchange
Alex: Heads Up!
The lesson plan is a hands-on project. Students will work in pairs to gather various measurements, organizing the data into a provided chart. The measurements will be used to review, reinforce, and introduce skills such as measures of...
Alabama Learning Exchange
Alex: Comparing Modes of Transportation
In this instructional activity students will visit different websites in order to decide the best mode of transportation from their home town to New York City. Students will use internet links during the instructional activity to gather...
TeachEngineering
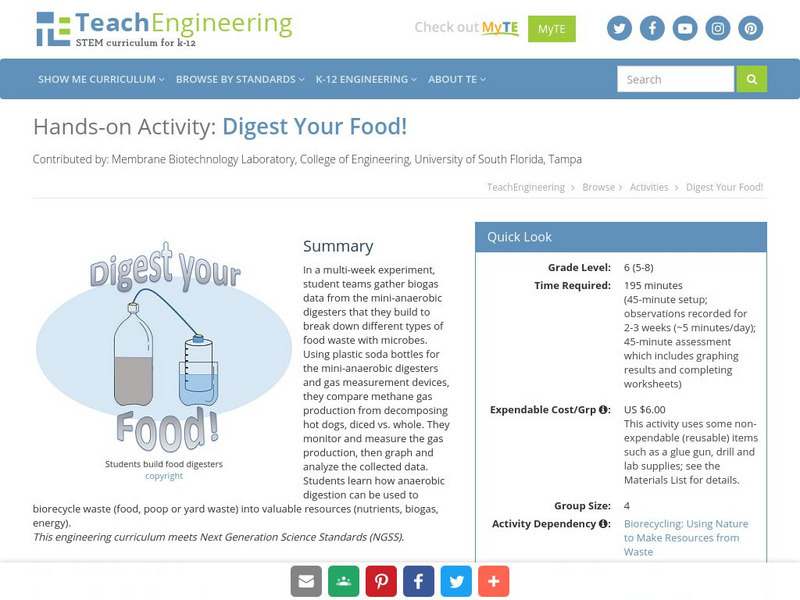
Teach Engineering: Digest Your Food!
In a multi-week experiment, student teams gather biogas data from the mini-anaerobic digesters that they build to break down different types of food waste with microbes. They compare methane gas production from decomposing hot dogs,...


