Curated OER
Temperature Bar Graph
Students explore mean, median and mode. In this math instructional activity, students analyze temperature data and figure the mean, median, and mode of the data. Students graph the data in a bar graph.
Curated OER
Math: Football Fever Fun
Students compile statistics from high school or other football team and construct a spreadsheet on which to record their findings. Using Chart Wizard to analyze the data, they construct charts and graphs for a visual display of the...
Curated OER
Where Should We Put a Store?
Students analyze population data. They convert population data into simple density maps to help make decisions about their world. They select the best location for a school store based on population density. They present their maps...
National Security Agency
Going Green with Graphs
In this unit designed for second graders, youngsters are introduced to conducting surveys and creating tally charts based on the data they gather. Students then construct bar graphs, and observe the relationships between the two...
Curated OER
Unit 2: Lesson 7
Students are introduced to spreadsheets. They conduct a survey of television viewing time of different shows based on different age categories. Students work in small groups. They collect, data and interpret the data from a survey.
Curated OER
Asthma Survey
Young scholars collect survey data on the prevalence of asthma in a community. They summarize and display the survey data in ways that show meaning.
Curated OER
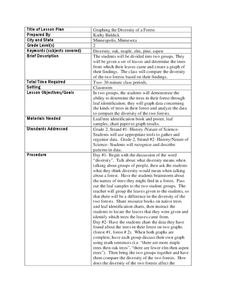
Graphing the Diversity of a Forest
Second graders work in groups to identify what types of trees create which types of leaves In this plant life lesson plan, 2nd graders analyze a set of leaves and identify the tree it came from while graphing the data in a science...
Baylor College
Body Mass Index (BMI)
How do you calculate your Body Mass Index, and why is this information a valuable indicator of health? Class members discover not only what BMI is and practice calculating it using the height and weight of six fictitious individuals, but...
Curated OER
Favorite Food
Students are given three choices of food. They then decide on their favorite and predict what the class's favorite food will be. After the teacher enters the data into the computer, students gather around the computer to view the...
Curated OER
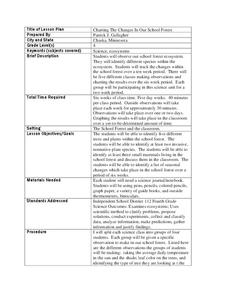
Charting the Changes in Our School Forest
Fourth graders investigate the ecosystem and how forests are disappearing. In this environmental protection lesson, 4th graders analyze the changes in their school for 2 weeks. Students practice identifying trees, birds, and...
Curated OER
Pie Graph
Fifth graders examine fractional parts of pie graphs. Given a bag of M&Ms, 5th graders interpret the data. They use a paper plate and colors to create a graph of the types of M&Ms represented.
Curated OER
Chart This!
Students collect and analyze data. In this middle school mathematics lesson, students collect data on three to four traits or favorites. Students analyze their data and create a chart of graph for each trait or favorite they...
Curated OER
Ketchup to Collecting Data
First graders collect data for a survey of 3 brands of ketchup and create class charts. They taste test three different brands of ketchup, and use the data to create a presentation. Tasty lesson!
Curated OER
Graphing Inertia: An Oxymoron?
Eighth graders investigate Newton's Law of Inertia in order to create a context for the review of the use of different types of graphs. They practice gathering the data from an experiment and put it into the correct corresponding graph.
Curated OER
The Bigger they Are . . .
Pupils do a variety of data analyses of real-life basketball statistics from the NBA. They chart and graph rebounding, scoring, shot blocking and steals data which are gathered from the newspaper sports section.
Curated OER
Graphing Pockets
Second graders explore graphing. They count the number of pockets on their clothes and use Microsoft Excel to enter their data. Students create a class graph displaying their findings.
Curated OER
Nutrition and Food Security
Examine the three basic nutrients and their effects on the body. Fifth graders will research data to construct a bar graph and then demonstrate the relationship between malnutrition and food security. This is a very comprehensive...
Curated OER
Waves
Light waves and sound waves are the focus of this science lesson designed for 5th graders. Besides discovering how these waves travel, learners also discover the basic properties of waves, and analyze data tables and graphs. The...
Curated OER
Drug and Alcohol Awareness
Fourth graders examine the statistics when it comes to teens and drug and alcohol abuse. In groups, they research the side effects of four different drugs. Using the information, they perform a skit, or puppet show to share their data...
Curated OER
Science and Technology
Students research inventions that have been created. In this historical technology lesson, students read the Harcourt Brace social studies textbook and discuss how inventors used graphs to display data. Students create a table to write...
Curated OER
Graphing Fun In Third Grade
Third graders display information in a graph, table, and chart. In this data lesson plan, 3rd graders look at graphs, tables, and charts, discuss their importance, and make their own.
Curated OER
Handling Data: Comparing Distributions
Pupils gather information by analyzing graphs, diagrams and pie charts. In this graphs and diagrams lesson, students complete addition and subtraction problems. Pupils discuss a pie chart. Students use information to crate a stacked bar...
Curated OER
Using Charts and Graphs to Study East Asia's Modern Economy
Students examine East Asia's modern economy. In groups, classmates use the internet to compare the resources, products, and economy of specified countries. After collecting the data, pupils create charts, tables and graphs. They...
Curated OER
Weather Lesson
Students discuss the weather conditions. They read thermometer, rain gauge, barometer, and wind direction and speed. They record observations of weather conditions and enter information into data base on the computer.


