Curated OER
Statistics Newscast in Math Class
Students study sports teams, gather data about the teams, and create a newscast about their data. In this sports analysis lesson, students research two teams and define their statistical data. Students compare the two teams, make...
Curated OER
High Five Board Game
For this high five board game worksheet, 8th graders use the game board and instructions provided to create ordered pairs using dice and cubes, then analyze the probability and predict outcomes.
Curated OER
Reading Graphs
Learners read graphs and charts to interpret results. In this algebra activity, students interpret bar, line and pictographs. They draw conclusions and make predicitons based on these charts.
Math Worksheets Land
Probability of Chance Events - Matching Worksheet
When choosing items probability can sometimes play a key role. Your mathematicians will explore this probability and how to calculate the values based on the scenario they have. Use this worksheet along with the additional resources...
Curated OER
Equations from Unit Rates
Your class can become linear equations masters, as they calculate the rate of change of a function. They observe different types of coordinates as they relate to a graph, then use the Ti-navigator to move the line around and draw...
Illustrative Mathematics
Rolling Dice
Rolling dice is a great way for your mathematicians to get a hands-on approach to probabilities. Use the chart to record whether they rolled a six during ten attempts. Calculate results individually (or in small groups) and then record...
Curated OER
Return Intervals & Reasoning from Tabular Data
Students calculate derivatives from a set of data. For this calculus lesson, students estimate the limit at infinity. They complete a Return Interval handout at the end of the lesson.
Curated OER
The STEREO Mission: Getting The Message Across
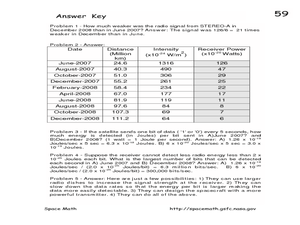
In this STEREO satellites worksheet, students are given a chart with the intensity of the signals from the satellites received on Earth and the distances of the satellite from Earth. Students convert the intensity at each distance to...
Curated OER
The Big Bang Theory
Students will use scientific reasoning to formulate ideas about the formation of the universe using the Big Bang Theory. The use of critical thinking skills is part of the activity and the foundation of the scientific method will serve...
Curated OER
Graphing
Students investigate graphing. In this bar graph lesson, students view an informational website about graphing, then construct a class birthday bar graph outside with sidewalk chalk. Students choose a survey topic, then collect data and...
Curated OER
Caesar Ciphers: An Introduction to Cryptography
Students brainstorm and discuss the concept of cryptography, the science of secrets in today's world and then focus on a system for sending secret messages used by Julius Caesar. They make a Caesar wheel assessing encrypting and...
Curated OER
Using Averages to Create Graphs Through Excel
Sixth graders create and use a spreadsheet to make graphs which will be used to analyze Progress Report and Final Report Card grades. They practice finding the mean, median, mode, and range of a data set. Students also incorporate column...
Curated OER
How Do You Spend Your Time?
Students keep records and determine how much time they spend on certain activities. They insert the data into a spreadsheet. Students graphically display data in a bar graph and a circle graph.
Curated OER
Do the Elephants Need Sunscreen? A Study of the Weather Patterns in Etosha
Students analyze the weather patterns in Namibia. They create a graph of the yearly temperatures and use the internet to gather information. They discuss how the weather goes in cycles in the area.
Curated OER
Graphing Data
Second graders graph data about their classmates. In this data analysis lesson, 2nd graders ask each other several questions about their hair color and eye color. Students graph the data that they collected.
Curated OER
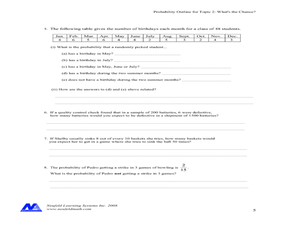
Concept: What's The Chance?
In this concept worksheet, students perform probability experiments. Using collected information, they interpret the data. Students answer questions about probability. This five-page worksheet contains approximately 15 multi-step...
Curated OER
The Solar Cycle
Students research the solar cycle. In this Science lesson, students use the internet to investigate the solar cycle. Students produce a spreadsheet and graph from the information collected.
Curated OER
What's Your Favorite Planet?
Fourth graders interpret a graph and make correlations using data. After taking a class survey, 4th graders create a class graph of their favorite planets. Working in small groups, they interpret the information and create at least ten...
Curated OER
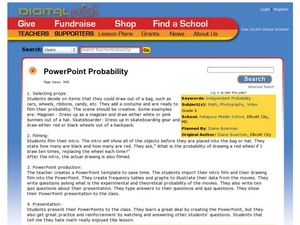
PowerPoint Probability
Sixth graders investigate film making by creating a video about probability. In this math visualization lesson, 6th graders create a presentation for their class demonstrating the probability of random events taking place in the real...
Curated OER
Mother May I?
Third graders measure distance using nonstandard units of measure. In this measurement lesson, 3rd graders measure a given distance through the use of the game "Mother May I?" Student gather and compare data on how many "giant steps" and...
Curated OER
Graphing Words Word Search
In this data vocabulary worksheet, students search for 16 graph-related words in a word search grid. Each word relates to graphing and collecting data.
Curated OER
My Test Book: Story Problems
In this math skills practice instructional activity, students solve 10 multiple choice math problems that require them to respond to story problems.
Curated OER
Collecting Data
In this data collection instructional activity, learners read about how data is collected and organized. They also learn about a hypothesis. Students read through examples of different charts and then answer 23 questions pertaining to...
Curated OER
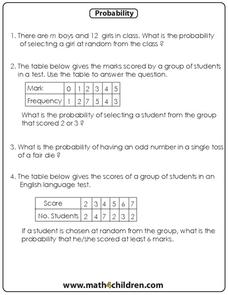
Probability
In this probability worksheet, students complete probability word problems containing one digit numbers about odd numbers, scores of a team, and more. Students complete 4 problems.
Other popular searches
- Frequency Tables Line Plots
- Math Frequency Tables
- Making Frequency Tables
- Reading Frequency Tables
- Creating Frequency Tables
- Cumulative Frequency Tables
- Frequency Tables 7th Grade
- Intro to Frequency Tables
- Making Frequency Tables Quiz


