Khan Academy
Khan Academy: Dot Plots and Frequency Tables Review
Dot plots and frequency tables are tools for displaying data in a more organized fashion. In this article, we review how to make dot plots and frequency tables.
Quia
Ixl Learning: Frequency Tables
Brush up on your math skills relating to frequency tables then try some practice problems to test your understanding.
Khan Academy
Khan Academy: Conditional Distributions and Relationships
A small private college was curious about what levels of students were getting straight A grades. College officials collected data on the straight A status from the most recent semester for all of their undergraduate and graduate students.
Texas Education Agency
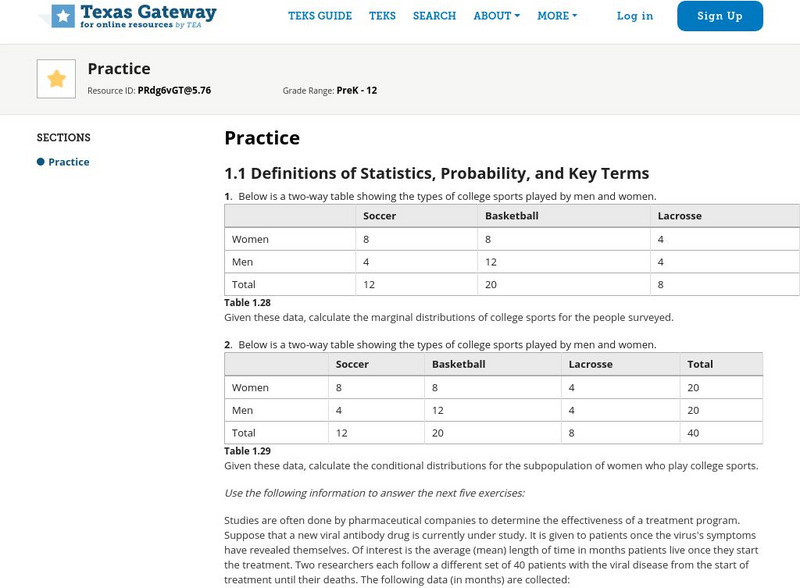
Texas Gateway: Tea Statistics: Sampling and Data: Practice
A set of exercises where students must analyze statistcal data and methodology and answer questions about distributions, sampling, results, accuracy, frequency, experimental design, and ethical practices.


