Other
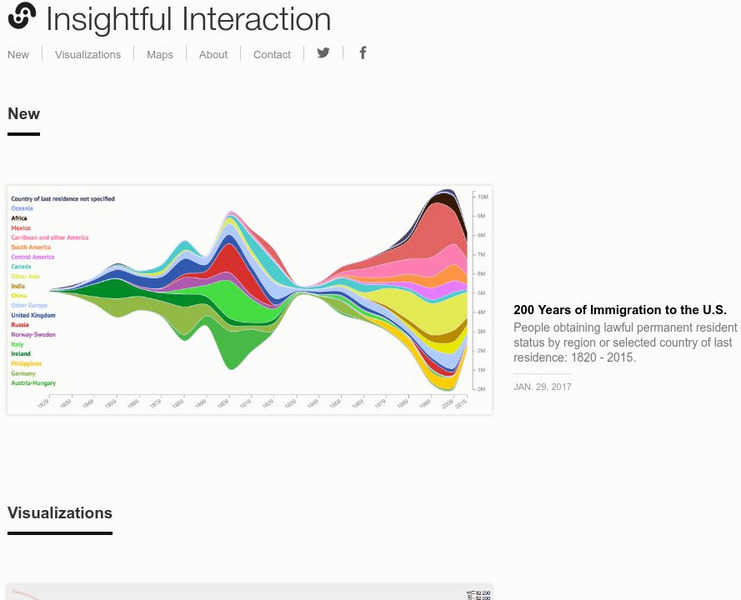
Insightful Interaction: Visualizations
A collection of interactive visualizations that were produced through analysis of economic, political, and market research data. Topics are diverse, e.g., military spending and trade, immigration, consumer spending, crime, unemployment,...
PBS
Pbs Learning Media: Global Warming: Graphs Tell the Story
Examine these graphs from the NOVA/ FRONTLINE Web site to see dramatic increases in the temperature of Earth's surface and greenhouse gases in the atmosphere.
US Energy Information Administration
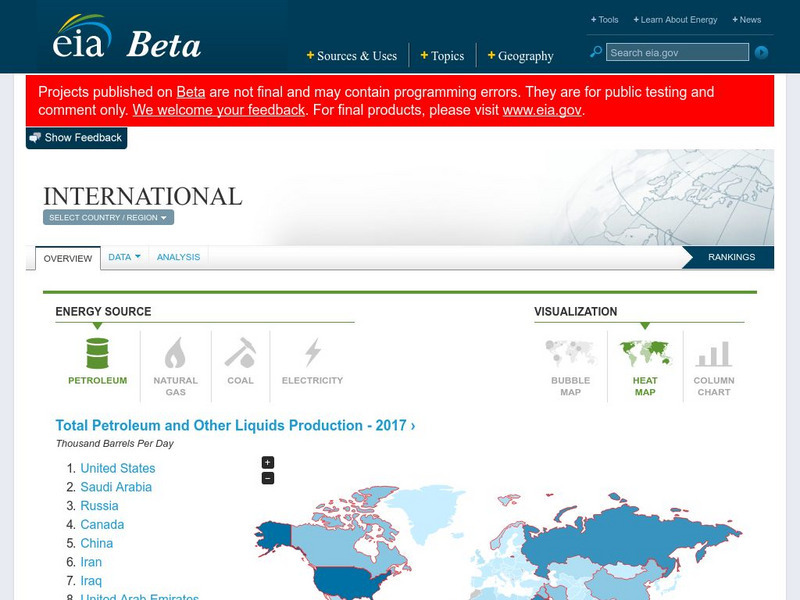
Energy Information Administration: Country Analysis Brief
Contains briefs with a narrative section, a map showing the country's location, and a section listing pertinent economic and energy data for every country in the world of interest to energy policy makers.
Energy4Me
Energy4me: Energy: Making Our Lives Easier
A complete slide show which teaches about the role petroleum natural gas play in our use of energy.
Curated OER
Science Kids: Science Images: Carbon Cycle Diagram
This carbon cycle diagram shows how carbon moves from one part of the Earth to another. Measured in gigatons, the storage and annual exchange involves oceans, vegetation, soil, fossil fuels, the atmosphere and more. For more information...
Sophia Learning
Sophia: Energy Forms: Lesson 3
This lesson will explain the advantages and disadvantages of generating electricity from various forms of energy. It is 3 of 4 in the series titled "Energy Forms."
Sophia Learning
Sophia: Energy Forms: Lesson 4
This lesson will explain the advantages and disadvantages of generating electricity from various forms of energy. It is 4 of 4 in the series titled "Energy Forms."
Other popular searches
- Fossil Fuels Experiments
- Formation of Fossil Fuels
- Fossil Fuels Activity
- Science Fossil Fuels
- What Are Fossil Fuels
- Dinosaurs and Fossil Fuels
- Environment Fossil Fuels
- Environment Fossil Fuels
- Depletion of Fossil Fuels
- Fossil Fuels (Labs)
- Cracking , Fossil Fuels
- Fossil Fuels Experements


