Illustrative Mathematics
Oakland Coliseum
Help algebra learners relate a real-life function that happens at the Oakland Coliseum every time the Raiders play. The resource states that the revenue of the Oakland Raiders home games is a function of the number of seats sold and the...
Education Development Center
Creating Data Sets from Statistical Measures
Explore the measures of central tendency through a challenging task. Given values for the mean, median, mode, and range, collaborative groups create a set of data that would produce those values. They then critique other answers and...
Barnstable Public Schools
Math Relay Races
A plethora of activities make up a cross curricular choice page filled with math games—relay races, dice, and crossword puzzles—a survey challenge equipped with data organization, graphing, a quicksand recipe, Hula-Hoop activity to...
Weekly Story Book
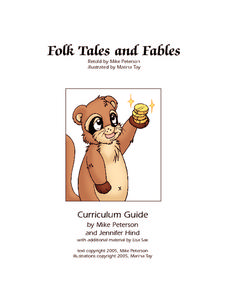
Folk Tales and Fables
Pages and pages of engaging activities, worksheets, and writing projects on teaching folktales and fables await you! You don't want to miss this incredible resource that not only includes a wide range of topics and graphic...
Houston Area Calculus Teachers
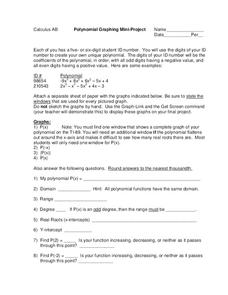
Polynomial Graphing
Your AP Calculus learners probably have their ID numbers memorized, but have they tried graphing them? Pique your pupils' interest by asking each to create a unique polynomial function based on their ID numbers, and then analyze the...
It's About Time
Effects of Plate Tectonics
Explore our world from within as you lead young scientists on a thrilling adventure. Pupils examine the location of plate boundaries to determine earthquake and volcano distribution around the globe and explore the cause of hot spots in...
It's About Time
Volcanic Hazards: Airborne Debris
Pupils interpret maps and graph data related to volcanic ash. Then they analyze the importance of wind speed and the dangers of the ash to both life, air temperature, and technology.
Curated OER
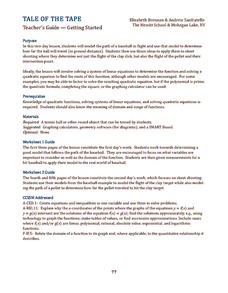
Tale of the Tape
How can baseball and skeet-shooting be modeled mathematically? Sports lovers and young mathematicians learn how to use quadratic equations and systems of equations to model the flight paths of various objects.
Illustrative Mathematics
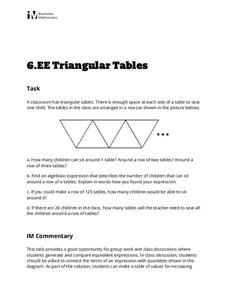
Triangular Tables
Somewhat of a puzzle, this problem gets pre-algebra preteens to write an expression representing a seating chart using triangle-shaped tables. This single task is an applicable lesson for meeting sixth grade Common Core math standards....
Illustrative Mathematics
Flu on Campus
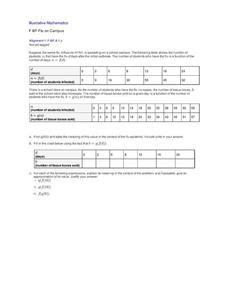
An outbreak of the swine flu on a school campus has caused an increase in the number of boxes of tissues sold by the school store. In a real-world-modeling activity, pupils use composition of functions to determine how the number of...
Cool Math
Coolmath: Functions Domain and Range
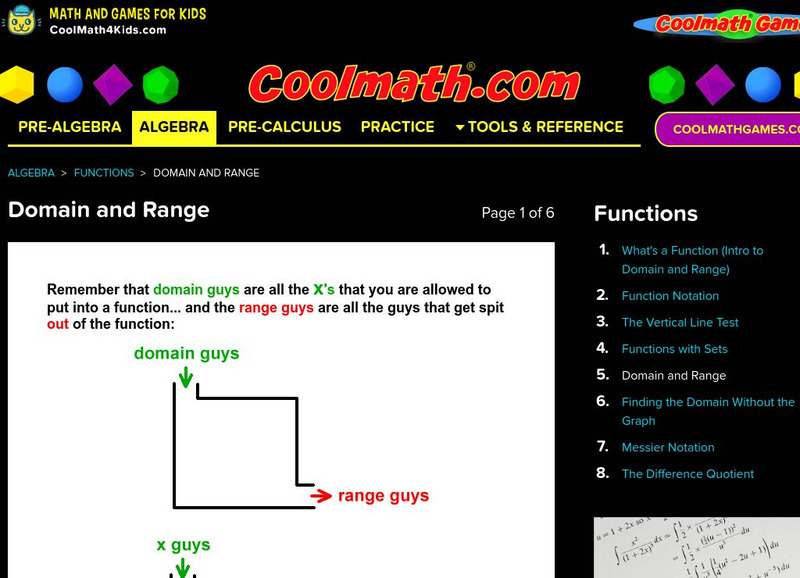
This algebra lesson explains to find the domain and range of a function by looking at the graph.
Varsity Tutors
Varsity Tutors: Hotmath: Algebra Review: Domain and Range
Find a quick, concise explanation of domain and range. Several examples are given and clearly explained.
National Council of Teachers of Mathematics
The Math Forum: Ask Dr. Math: Domain and Range
This page from the Math Forum contains a question and answer session on how to find range in rational functions. Example problem is given.
Texas Instruments
Texas Instruments: Functions
With these questions, students will demonstrate knowledge of the definition of a function as well as domain and range. Students will also be asked to find the composition of two functions. Solutions are provided.
Interactive Mathematics
Interactive Mathematics: Functions and Graphs
The system created by Rene Descartes (1596-1650 CE) is explored in depth, covering topics such as definitions, notation, evaluating, domain and range, graphing and more. Interactive examples and demonstrations are enhanced using Live...


