Virginia Department of Education
May I Have Fries with That?
Not all pie graphs are about pies. The class conducts a survey on favorite fast food categories in a lesson plan on data representation. Pupils use the results to create a circle graph.
K12 Reader
Displaying Data
It's important to learn how to display data to make the information easier for people to understand. A reading activity prompts kids to use context clues to answer five comprehension questions after reading several paragraphs about...
Curated OER
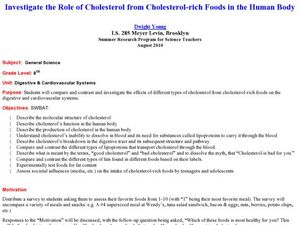
Investigate the Role of Cholesterol from Cholesterol-rich Foods in the Human Body
Eighth graders assess fat content of different food samples. In this biology lesson plan, 8th graders create a flowchart showing the transport of cholesterol in the bloodstream. They perform tests for the presence of lipids on food samples.
Curated OER
Tasty Tech Activity With Excel
Students are introduce to basic Excel skills, rank their opinions of menu items from fast food restaurants, add their answers to the spreadsheet, and then create a simple graph of the results.
Curated OER
A Picture is Worth a Thousand Words: Introduction to Graphing
Students practice graphing activities. In this graphing lesson, students discuss ways to collect data and complete survey activities. Students visit a table and graphs website and then a create a graph website to practice graphing.
Curated OER
Graphs to Represent a Data Set
Here are a some pre-made sets of data that kids can use to practice data analysis. There are 10 survey scenarios written out, and scholars synthesize the results of each into a bar graph. In addition to the graphing, they answer two...
Illinois Department of Natural Resources
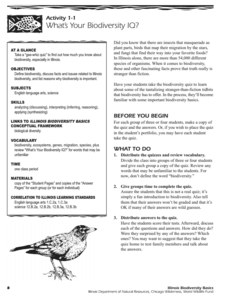
Section One: What is Biodiversity?
Four intriguing and scientific activities invite learners to explore the natural resources of their town. The activities cover concepts such as genetic traits, organizing species in a taxonomy, the differences between different species...
Curated OER
Graphs that Represent Data Sets
Use these pre-made data sets to introduce kids to bar graphs and data analysis, and then have them take surveys on their own. There are 10 survey scenarios written out here, and scholars synthesize the results of each into a bar graph....
Curated OER
Graphs Abound
Students create a survey for their classmates to collect data on their favorite foods, eye color, pets or other categorical data. They compile the data from the survey in a table and then make a bar graph of each category using a web tool.
Curated OER
Data collection and analysis
In this probability and statistics worksheet, high schoolers determine when a survey or collected data could be biased. The one page worksheet contains a combination of three multiple choice and free response questions. Answers are...
Curated OER
Opening a Restaurant
Learners design a survey of the public as to what type of food should be served in restaurant that they are "planning" to open.
Curated OER
Bar Graphs
Students perform operations and graph their data using charts and bar graphs. For this algebra lesson, students follow specific steps to make a bar graph. They create a survey about people favorite things and plot their data from the...
Curated OER
Oklahoma Stone Soup
Class members complete activities related to the story "Oklahoma Stone Soup." First, pupils read, discuss, and answer questions about the story. Next, to incorporate math into the lesson, learners make stone soup using a variety of...
Curated OER
Mayor Puts City on Diet to Lose a Million Pounds
Students read a story called Mayor Puts City on Diet to Lose a Million Pounds and answer vocabulary and comprehension questions about it. In this current event Lose a Million Pounds lesson plan, students respond to literature by...
Curated OER
Data Collection - Primary Poster
Students explore the concept of collecting, analyzing, and graphing data. For this collecting, analyzing, and graphing data lesson, students create a survey about a topic of interest. Students poll their classmates, analyze, and graph...
Curated OER
Making Graphs
Learners explore statistics by conducting class demographic surveys. In this graph making lesson, students identify the family members of each classmate, pets they own, and favorite activities. Learners organize their statistics and...
Curated OER
Party Time
Learners design a budget to plan for a class party. In this problem solving lesson plan, students devise a budget with a limit of fifty dollars for a class party. Learners discuss and estimate the amount of money needed for food and...
Curated OER
Color My World
Pupils examine colors and describe how colors contribute to the way a person may feel after listening to several books. Students also survey class for favorite colors and graph results, as well as discover how different colors are made...
Curated OER
Making a Spreadsheet
Young scholars explore spreadsheet software. In this personal finance and computer technology activity, students develop a vacation spreadsheet on the computer. Young scholars represent hotel, food, transportation, and entertainment...
Curated OER
Chart/Graph
Students create a class survey, place the data in a spreadsheet and graph the information.
Curated OER
Breakfast Venn Diagram
What are your youngsters' favorite breakfast? They examine a Venn diagram with pictures of three breakfast preferences: grits, cereal, or eggs. Then, have them place their initials in a space to indicate favorite choices. This is an...
Curated OER
Apple Eaters
Learners sample a variety of apples and graph group results for the class favorites. They orally explain the graph.
Curated OER
The Numbers Tell the Story
Students demonstrate how to gather and interpret statistical data. In this data analysis lesson plan, students search for statistics on the health effects of smoking and place the information into charts. Students create these charts...
Curated OER
The Average Kid
Students determine the traits they have in common with other students in the class and create visual profiles of the "average" boy and the "average" girl.


