Radford University
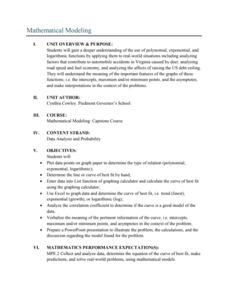
Mathematical Modeling: Lessons 2-3
Not all functions are created equal. Pupils apply regression analysis using polynomial, exponential, and logarithmic functions to investigate the relationship between variables and to decide which function would be best to model the...
Curated OER
Curve Fitting
Pupils investigate linear, quadratic, and exponential regressions. They plot sets of data points, determine the regression equation that best fits the data and lastly investigate the coefficient of determination.
Curated OER
More of U.S.
Explore graphical representation of a real-life data set and determine the exponential regression model for the data in your classroom. Students also compare the estimated value to the given value by determining the percent error.
Curated OER
Chill Out: How Hot Objects Cool
Teach how to explore exponential equations. In this Algebra II activity, students investigate the graph that occurs as a hot liquid cools. Students model the data algebraically.
Curated OER
The Regression Line and Correlation
Students investigate the best fit line through plotting on the TI. In this math activity, students examine their data representing regression lines and correlation. They use interactive technology to differentiate between linear and...
Curated OER
Leap Into Exponential Functions
Students use properties of exponents to solve equations. In this algebra lesson, students add, subtract, multiply and divide exponential functions. They graph and differentiate between exponential growth and decay.
Virginia Department of Education
Logarithmic Modeling
Explore logarithms and logarithmic regression. Young mathematicians first learn about inverse functions and about the logarithm function family. They take their newfound knowledge to use logarithmic functions to model situations and...
Kenan Fellows
Lego Thinking and Building
Run a simulated airplane manufacturing plant with your pupils as the builders! Learners build Lego airplane models and collect data on the rate of production, comparing the number produced to the number defective. Using linear...
Radford University
Mathematical Modeling: Lesson 1
Will more deer result in more big game licenses? Scholars first research data on the number of deer and the number of big game licenses in Virginia between 1990 to 2009. They apply polynomial, exponential, and logarithmic regression to...
PBL Pathways
Cell Phones
Calling all subscribers! Model revenue based on individual cell phone subscribers. The project-based learning activity presents a challenge to scholars from a cell phone company. Individuals model data provided to them from the company...
Radford University
Sleep and Teen Obesity: Is there a Correlation?
Does the number of calories you eat affect the total time you sleep? Young mathematicians tackle this question by collecting their own data and making comparisons between others in the class through building scatter plots and regression...
Curated OER
Will Exams Be Cancelled?
If the flu outbreak continues, exams will have to be canceled. Investigate the properties of exponential and logarithmic functions. In this algebra lesson plan, young scholars use the TI to examine and differentiate between exponential...
Curated OER
Strike a Pose: Modeling in the Real World (There's Nothing to It!)
Adjust this lesson to fit either beginning or more advanced learners. Build a scatter plot, determine appropriate model (linear, quadratic, exponential), and then extend to evaluate the model with residuals. This problem uses real-world...
Virginia Department of Education
Curve of Best Fit
Which function models the data best? Pupils work through several activities to model data with a variety of functions. Individuals begin by reviewing the shapes of the functions and finding functions that will fit plotted data points. By...
PBL Pathways
Students and Teachers 2
Examine trends in student-to-teacher ratios over time. Building from the first task in the two-part series, classes now explore the pattern of student-to-teacher ratios using a non-linear function. After trying to connect the pattern to...
Kenan Fellows
Density
Most scholars associate density with floating, but how do scientists determine the exact density of an unknown liquid? The third lesson in a seven-part series challenges scholars to find the mass and volume of two unknown liquids. Each...
Curated OER
Calculator-Based Lessons Help Examine Real-World Data
Students may determine equations based on graphs and regression models.
NASA
Space Shuttle Ascent: Altitude vs. Time
How long did it take to get to that altitude? Using a Google Earth file, groups explore a space shuttle launch. Using a calculator, groups determine the function that models the altitude/time data from an actual launch. With the model in...
Curated OER
M&M Exponential Activity
Students create a scatter plot of their experimental data. In this algebra lesson, students use M&M's to determine an algebraic model. They discuss results in class.
Curated OER
Means of Growth
Students collect and graph data. In this statistics lesson, students analyze their plotted data using a scatter plot. They identify lines as having positive, negative or no correlation.
Curated OER
Carbon Dating
Simulate C-14 decay using M&M and Reese's Pieces candies. In this scatter-plot lesson, students perform an experiment to simulate the half life of C-14. Information is plotted on a scatter-plot. Students answer four comprehension...
Mathalicious
Pic Me!
Finally! Math and Instagram have come together to discuss the correlation between likes and followers. High schoolers can't help but want to discover what makes one account more popular than another by developing a line of best fit and...
Curated OER
Application of Graph Theory
Students investigate different online tutorials as they study graphing. For this graphing lesson, students apply the concept of graphs cross curricular and use it to make predictions. They define the purpose and theories behind graphs.
Curated OER
How Long Can You Go?
Eighth graders examine the usefulness of a line of best fit by collecting and graphing data, using a graphing calculator to determine the line of best fit, and making a variety of predictions. They watch a video, then design a...


