Earth Watch Institute
Entering Local Groundhog Data in an Excel Spreadsheet
Here is a cross-curricular ecology and technology lesson plan; your learners create spreadsheets depicting the location and number of groundhog dens in a local park. They research groundhogs and analyze data about where the groundhog...
Council for Economic Education
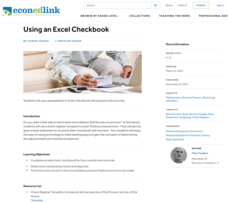
Using an Excel Checkbook
High school is the time that many scholars get their first jobs. Help young entrepreneurs apply economic principles to crucial skills for their new jobs and for functioning in society in general. They use Excel to balance a checkbook by...
Open Oregon Educational Resources
Beginning Excel
How can Microsoft Excel help manage data in people's personal and professional lives? Using the Beginning Excel eBook, scholars learn the basics of creating, editing, and using spreadsheets. They explore spreadsheet design, formulas,...
Howard Hughes Medical Institute
Spreadsheet Tutorial 1: Formulae, Functions, and Averages
Spread your knowledge of spreadsheets. The first of five tutorials in the Spreadsheet Data Analysis unit introduces the basics of spreadsheets. It shows future data analysts how to organize and format tables, and how to use functions to...
Howard Hughes Medical Institute
Spreadsheet Tutorial 2: Autofill Data, Cell References, and Standard Deviation
If you've always wanted to know more about spreadsheets, here's a perfect resource for you. A self-paced tutorial introduces how to autofill and copy formulas in a Google sheet or Excel spreadsheet. It also shows users how to find range,...
Howard Hughes Medical Institute
Spreadsheet Tutorial 5: Histogram
A professional-looking histogram is just a few clicks away. The last installment of a five-part Spreadsheet Data Analysis series focuses on histograms. Learners work through a tutorial to see how spreadsheets can help make frequency...
Curated OER
Basic Excel
Students explore basic Excel spreadsheets. In this spreadsheet lesson plan, students enter Alaska weather information and perform calculations. Students title the columns on the spreadsheet and format the cells. Students complete...
Curated OER
Graphing Using Excel
Fifth graders complete a series of graphs by gathering information and using Excel to graph the information. In this graphing lesson, 5th graders graph favorite desserts of the class. Student put their results into the computer and then...
Curated OER
Using a Spreadsheet
Students create a spreadsheet to analyze data. In this technology lesson, students develop and use an Excel spreadsheet to log their data. They solve real life word problems as they set it up using the spreadsheet.
Curated OER
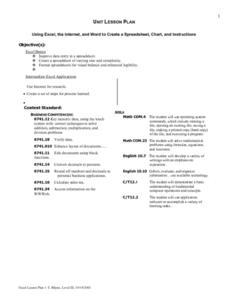
Using Excel, the Internet, And Word To Create a Spreadsheet, Chart, And Instructions
Learners improve data entry in a spreadsheet.
Curated OER
EXCEL It!
Students surf the Web gathering information about graphs. The data collected is incorporated into an Excel spreadsheet and graphs of varying nature generated to further enhance student understanding.
Curated OER
"Living in the Limelight The Universal Dream"
Students, using Leo's Lyrics, investigate common themes in popular music. They create a Microsoft Excel spreadsheet that analyzes their findings along with a 200 word paragraph stating their observations, conclusions and hypotheses about...
Curated OER
Calculating Profits from Selling Virtual Lemonade
Students set up and collect data for a virtual lemonade stand. In this entrepreneurship, economics, and technology instructional activity, students purchase ingredients, determine costs, and set up a virtual lemonade stand. Students...
Curated OER
Graphing
Learners gather statistical information on a chosen topic and place it into a spreadsheet. Using th Excel chart wizard, students create tables, graphs and charts of their information. They interpret the data and share it with the class.
Curated OER
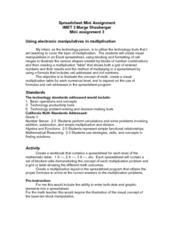
Using Electronic Manipulatives in Multiplication
Factor polynomials using electronic manipulatives. Your class will create a spreadsheet in excel and use it to multiply and perform basic operations and solve problems correctly. They create a visual to go along with each multiplication...
Curated OER
Building Arrays Using Excel Spreadsheets
Students create arrays using Microsoft Excel. In this technology-based math lesson, students expand their knowledge of multiplication by creating arrays on the computer using a spreadsheet program such as Microsoft Excel.
Curated OER
Lemonade Business
Twelfth graders use all features of Microsoft Excel and Microsoft Power Point to create charts and graphs. They use charts and graphs to make a Power Point Presentation.
Curated OER
Excel temperature Graphs
Students gather data about the weather in Nome, Alaska. In this Nome Temperature lesson, students create an excel graph to explore the weather trends in Nome. Students will find the average weather and add a trend line to their graph.
Curated OER
Using Averages to Create Graphs Through Excel
Sixth graders create and use a spreadsheet to make graphs which will be used to analyze Progress Report and Final Report Card grades. They practice finding the mean, median, mode, and range of a data set. Students also incorporate column...
Curated OER
Graph Frenzy!!
Students brainstorm for a survey question to ask classmates. They survey their classmates. They enter the results into a spreadsheet and create the best graph for the information. They share their graphs with the class.
Curated OER
Spreadsheet Graphs
Students create graphs using information from spreadsheets. They select a topic from the following choices: website use, digital cameras, spreadsheets, calculators or educational software. They tally the class results and create an...
Curated OER
Spreadsheet Project: Planning a Party
Students create a spreadsheet and stay within a budget as they plan a class party for the next holiday.
Curated OER
Endangered Species
For this geography worksheet, high schoolers identify how to manipulate data on a range of endangered species. They create a bar graph of endangered animals from Africa, Asia, Australia, North America, or South America. Students use a...
Curated OER
Creating a Nutrition Table in MicroSoftExcel
Students access the internet to find Nutritional information from a restaurant of their choice and compile their information into an excel spreadsheet.
Other popular searches
- Excel Spreadsheets
- Microsoft Excel Spreadsheets
- Using Excel Spreadsheets
- Excel Spreadsheets Graph
- Excel Spreadsheets Planets
- Creating Excel Spreadsheets
- Excel Spreadsheets Football
- Excel Spreadsheets Grades
- Nfl Excel Spreadsheets
- Excel Spreadsheets Soccer
- Basic Excel Spreadsheets
- Excel Spreadsheets Di Da


