Curated OER
Excel temperature Graphs
Students gather data about the weather in Nome, Alaska. In this Nome Temperature lesson, students create an excel graph to explore the weather trends in Nome. Students will find the average weather and add a trend line to their graph.
Education World
A Spooky Adlib Story
Students navigate a simple spreadsheet and develop their creativity. They answer questions, filling in cells on Excel, using a template after filling in all the fields, a silly spooky story is created from the answers they give. Students...
Curated OER
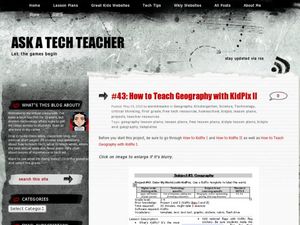
How to Teach Geography with KidPix II
Learners use the computer program KidPix II to color a map of the world. In this world map lesson plan, students fill in different colors for different continents that are told to them on the program KidPix II.
Curated OER
What Would it Cost You Today?
Learners explore inflation and the role played by advertising and marketing over the years. In this financial literacy lesson, students complete worksheets, do Internet research, and create an excel spreadsheet comparing prices from...
Curated OER
Careers
Eighth graders research careers on the computer to determine which career they are interested in. They create a spreadsheet using the Excel program and calculate the budget for their desired lifestyle and determine if this income is...
Curated OER
Technobiz
Students examine candy preferences to create a plan in order to improve candy sales. In this technobiz lesson plan, students build spreadsheet and organizational skills by graphing and calculating data. Students are introduced to...
Curated OER
Group Advertising Project Using iMovie
Students, while working in groups, pick a product or service from one company to invest in for the Newsday Stock Market Game. They develop an advertisement for the product or service utilizing the iMovie program on the computers.
Curated OER
Graphing Population Around the World
Students define specific vocabulary necessary for understanding population data. They collect, analyze, and interpret specific data. They utilize computer programs in order to create graphs of collected data.
Curated OER
Ancient Mesopotamian and Egyptian Writing
Middle schoolers research cuneiform and hieroglyphics from the internet and use educational software to create their own cuneiform tablet in this excellent World History lesson. The use of the computer software program Inspiration 7.5...
Curated OER
From Ada to Grace to Sandy - Women Have IT
Explore the significant contributions women have made in the field of information technology with an instructive lesson plan. Through class discussion and research, students discover how women have aided in the growth of the field of...
Curated OER
Temperature Graphing
Fifth graders analyze temperature variations throughout the world by using computer graphing of select major national and international cities.
Curated OER
Temperature Graphing
Pupils analyze temperature variations throughout the world by using computer graphing of select major national and international cities. After analyzing their findings, students write a paragraph explaining their data.
Curated OER
Design a Community Flag
Students research basic principles for flag design. They investigate where their city flag ranked in a national survey. Students use computers and apply the principles of flag design to create their own community flags.
Curated OER
Graphing Data on Ellis Island
Third graders use data to make a bar graph. For this graphing and social studies lesson, 3rd graders use data about where Ellis Island immigrants came from to complete a bar graph on Microsoft Excel.
Curated OER
Designing Another Juilliard
Ninth graders explore the characteristics for a top notch school. In this Social Studies lesson plan, 9th graders create their own fictional school that promotes excellence in a discipline of their choice. Students read Frank...
Curated OER
SIRS Discover: Native American Biographies
Fourth graders work in cooperative groups to select and evaluate appropriate magazine articles on Native Americans. They view the program SIRS Discoverer, complete activity sheets then perform oral presentations.
Curated OER
Breaking News English: We Spend Half Our Time Daydreaming
In this English worksheet, students read "We Spend Half Our Time Daydreaming," and then respond to 1 essay, 47 fill in the blank, 7 short answer, 20 matching, and 8 true or false questions about the selection.
Curated OER
My Community
First graders design a Powerpoint presentation to reflect information about their community. In this community lesson, 1st graders create slides to explain the weather, geography and other information about the city.
Curated OER
Archaeology Vocabulary Sampling
Learners predict how many words out of ten they accurately define. They match the definitions to the correct vocabulary words and make a bar graph showing how many definitions were matched to the correct words. The write their group...
Curated OER
Every Vote Counts
Students participate in an activity designed to increase student awareness and participation in the voting process.
National Council of Teachers of Mathematics
National Debt and Wars
Take a functional approach to the national debt. Learners collect information about the national debt by decade and plot the data. They determine whether an exponential curve is a good fit for the data by comparing the percent changes...
Curated OER
Inform Your Vote
Students examine and participate in the election process, analyze current event topics and offer their opinions. They then share their viewpoints on civic issues. They are encouraged to do additional research on the election's hot issues.
Curated OER
Country Comparisons in Current Events Class
Students collect political, socioeconomic, geographical, and other data about 10 countries and record their data in a spreadsheet. The information is used to fuel current events discussions.
Curated OER
Racial discrimination against the Chinese in the late 19th and early 20th centuries
Students examine the stereotypes of Chinese immigrants to Australia in the late 19th and early 20th centuries. They evaluate the validity of these stereotypes and investigate various pieces of legislation that discriminated against the...


