Curated OER
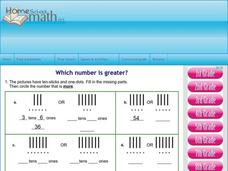
Which Number is Greater?
Students draw pictures of two digit numbers to identify the greater value. In this math instructional activity, students plot two digit numbers on a number line and identify the greatest or lesser value. Students use the greater than and...
Curated OER
Introduction to Graphical Representation of Data Sets in Connection to Cellular Growth
Young scholars practice graphing relationships between variables by studying topics such as exponential growth and decay. They conduct a series of numerical experiments using a computer model and a variety of physical experiments using...
Curated OER
Introduction to Graphical Representation of Data Sets in Connection with Nuclear Decay
Students record data, make observations, and share in experimentation and discussion of numerical experiments.
Curated OER
A4 Containers
Fifth graders determine which container made from a single sheet of paper has the greatest volume. They look the solutions made by three different students before working on their own examples.
Curated OER
Rings and Diamonds
Fifth graders solve a problem by using systematic problem solving strategies. They determine if there is enough information to solve the problem. They solve a problem involving geometric shapes and area.
Curated OER
Bubble Gum Chemistry
Students explore the concept of graphing data. In this graphing data lesson, students determine the percentage of sugar in bubble gum. Students graph type of gum vs. sugar percentage. Students create a table of their data.


