Hi, what do you want to do?
Texas Instruments
Texas Instruments: Graphing Calculator: Problem Solving and Investigations
Over 30 reproducible, motivating investigations designed especially for middle school students to use with any TI Graphing Calculator model.
Texas Instruments
Texas Instruments: You're Probably Right, It's Wrong
In this activity, students perform a simulation to guess answers on a test and determine the experimental probability of passing the test. They then compare it with the theoretical probability.
Texas Instruments
Texas Instruments: Analyzing Variance (Anova)
Students analyze variances of various data samples.
Texas Instruments
Texas Instruments: Type I and Type Ii Errors
This set contains questions regarding Type I and Type II errors, and the power of an inference test. Students differentiate between Type I and Type II errors, and their relationship to the null and alternative hypotheses.
Texas Instruments
Texas Instruments: Numb3 Rs: Is It Really Rare?
Based off of the hit television show NUMB3RS, this lesson introduces students to the Poisson Distribution to determine the probability of events happening a certain number of times in a given time period. The lesson is framed in the...
Texas Instruments
Texas Instruments: An Explosive Controversy the Monte Hall Dilemma
Students are introduced to the Monte Hall Paradox and the storm of controversy it provoked when it appeared in the Ask Marilyn column of Parade Magazine. The letters and testimonials challenge students and generate animated classroom...
Texas Instruments
Texas Instruments: Some Nonparametric Tests
Students explore nonparametric tests for dependent and independent data samples.
Texas Instruments
Texas Instruments: Collecting Data
In this activity, students investigate how to use random numbers to collect samples and how to randomly assign subjects to experiments to collect data. They also use the CBL system to collect data in real time.
Texas Instruments
Texas Instruments: Z Tests
Students will be lead through the process of using the calculator to solve z test problems.
Texas Instruments
Texas Instruments: Tests of Significance
Students understand how tests of significance can be performed with confidence intervals. They use a simulation to clarify the meaning of a hypothesis. Students examine large sample tests for a proportion, mean, difference between two...
Texas Instruments
Texas Instruments: Sampling Distribution of Differences
This activity covers the distribution of a difference between two independent sample proportions or two independent sample means.
Texas Instruments
Texas Instruments: Numb3 Rs: The Eyes Have It
Based off of the hit television show NUMB3RS, this lesson lands students as investigators who must explore the usefullness of iris scan (security) algorithms. In the first part of a lesson, a given probability is used to determine how...
Texas Instruments
Texas Instruments: Special Cases of Normally Distributed Data
Students perform single and two-sample t procedures to investigate special cases of normally distributed data. They explore inference for a least-square regression line, including the confidence interval.
Texas Instruments
Texas Instruments: Describing Categorical Data
Young scholars analyze the distribution of categorical data. They calculate percents and visually compare the data sets with a bar chart.
Texas Instruments
Texas Instruments: The Normal Distribution
In this activity, students will apply the normal density function, normal cumulative distribution function, and inverse normal cumulative function to analyze a population with a normal distribution.
Texas Instruments
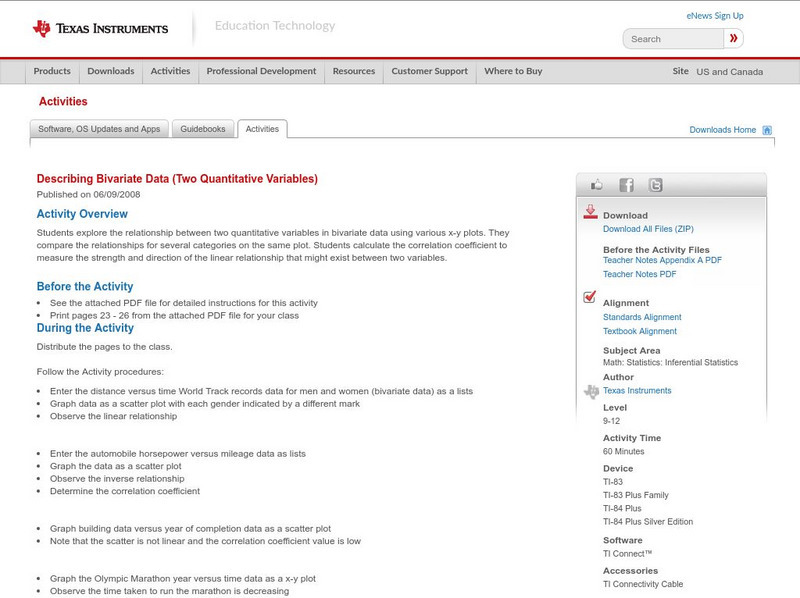
Texas Instruments: Describing Bivariate Data (Two Quantitative Variables)
Students explore the relationship between two quantitative variables in bivariate data using various x-y plots. They compare the relationships for several categories on the same plot. Students calculate the correlation coefficient to...
McGraw Hill
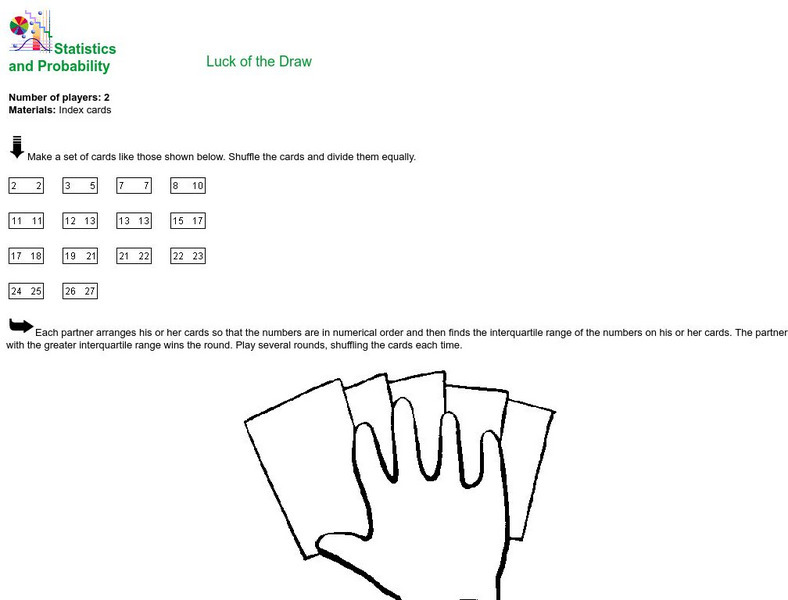
Mc Graw Hill Education: Glencoe: Statistics and Probability: Luck of the Draw
Instructions for creating and playing a simple card game through which students can practice calculating the interquartile range from a set of numbers.
Other
Safety & Consumer Protection: Seat Belt Safety
This website provides a general look at how safety belts, air bags, nad child safety seats protect passengers and save lives. Includes statistics as well as "life-saving advice."
Other
El Diario Informacion General De Bolivia
This site is a reference to vital statistics and other data about the country of Bolivia. General information on the history, government, environment, and tourism of Bolivia are also provided. Illiteracy rate, average number of years of...
Texas Instruments
Texas Instruments: Spin Me Along
Students explore probability and patterns in fractions, decimals, and percents by spinning three spinners and recording and analyzing the results.
Texas Instruments
Texas Instruments: Using the Ti 83/84 to Explore the Binomial Theorem
This lesson will introduce students to the binomial theorem through a variety of activities. Pascal's triangle and probabilities will be explored through problem solving. The binomial theorem, combinations formula, and the binomial...
Texas Instruments
Texas Instruments: What Are the Chances?
In this activity, students determine the probability of a spinner landing on a certain number in eleven trials. They also learn to change the weightage and find subsequent effect on the probability.
Texas Instruments
Texas Instruments: Tiles in a Bag
How many tiles would you have to pick to be confident that your estimated probability truly represents the situation? In this activity, you will draw a tile from a bag, record its color and put it back in the bag. The bag contains 24...
Texas Instruments
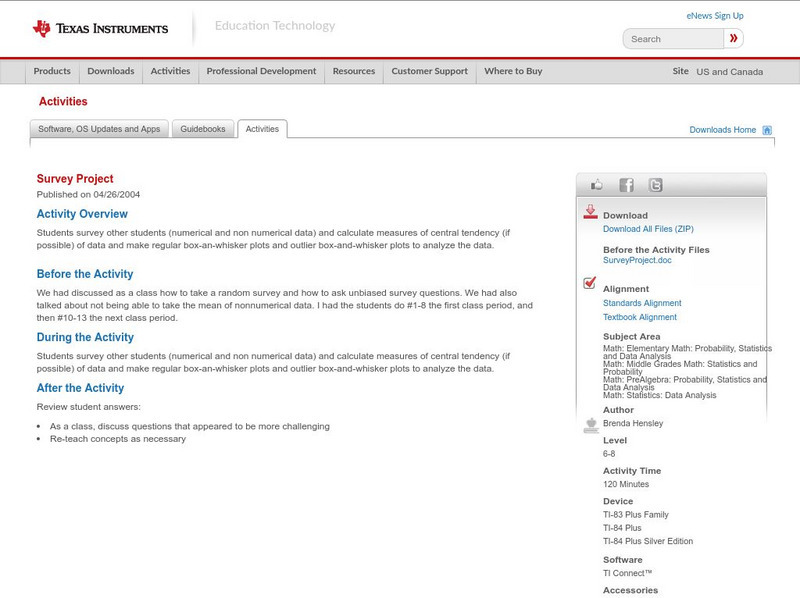
Texas Instruments: Survey Project
Students survey other students (numerical and non numerical data) and calculate measures of central tendency (if possible) of data and make regular box-an-whisker plots and outlier box-and-whisker plots to analyze the data.


