Curated OER
Graph the Presidents At Inauguration- How Old Were They?
Students construct a graph of the presidents' ages at inauguration. In this U.S. history instructional activity, students use online resources to gather data about the presidents and accurately present their results on a graph.
Center of Excellence for Science and Mathematics Education
A Sick Astronaut
Aspiring astronauts graph, interpret, and analyze data. They investigate the relationship between two variables in a problem situation. Using both graphic and symbolic representations they will grasp the concept of line of best fit to...
Curated OER
Celebrate Sunflowers
Students skip count with sunflower seeds. In this interdisciplinary lesson, students discuss the history of sunflowers. Students count by 1's, 2's, and 10's with bags full of sunflower seeds.
Curated OER
The Demographics of Immigration: Using United States Census Data
Learners work together to analyze United States Census data on immigration. They compare and contrast the data and determine how immigration numbers have changed over time. They calculate percentages and make their own conclusions...
Curated OER
Mean, Median, and Mode
Seventh graders examine the uses of mean, median, and mode. They define key vocabulary terms, observe the teacher model examples of mean, median, and mode, and discuss real world examples of central tendency of sets of data. Students...
Curated OER
What Did It Cost 100 Years Ago?
Students compare prices of good across the century in order to introduce the topic of inflation. They undertand the concepts of inflation and Consumer Price Index (CPI), use online calculators to figure the approximate cost of goods...
Curated OER
Lego Robotics: Measuring Speed
Students build and program a LEGO robotic car as well as measure and graph its speed. They acquire familiarity with principles of construction, motion, design and problem solving. They compare a robot's speed over two different surfaces...
Curated OER
Ratio Basketball
Students, in teams of four, practice shooting free throws while mentally converting the ratio of shots made to those thrown into a percent. They chart and record the ratio, decimal and actual percentage earned after each round.
Curated OER
Which Amusement Park Would You Choose?
Students analyze data related to amusement parks and create a spreadsheet to display the data. They read the data and predict which amusement park they think is safer, create a spreadsheet and graph, and write a proposal based on their...
Curated OER
Burger King Investigation
Students study data on the nutritional value of Burger King meals in order to discover its nutritional value and also to compare the meals, using mathematical computation, to the recommended daily diet. In this data handling lesson,...
Curated OER
Creating Circles
Students make a circle graph. In this graphing lesson, the teacher conducts a class survey, then demonstrates how to make a pie graph. When students are comfortable with the material, they use a worksheet to create their own graph.
Curated OER
How Many People Live in Your Household?
Learners create a pictograph showing household size for the class.In this data collection and graphing lesson, the teacher guides students through the creation of a concrete object graph, then learners analyze and summarize the results.
Curated OER
Equivalent Decimals
Students develop strategies to find equivalent decimals. In this equivalent decimals lesson, students participate in a variety of decimal games to find equivalent decimals.
Curated OER
NCAA Basketball finals
Students read and interpret graphs of data sets. The data is used to devise reasons as to why teams in the NCAA Basketball finals from the 1950'sand up have the highest scores.
Curated OER
Math for the Frontier
Students explore the concept of inflation. In this inflation instructional activity, students compile a list of necessities they would need to take with them if they were moving to a new state next month. Students compare their list...
Curated OER
Math Hunt: Extreme Weather
Students investigate integrals. In this math lesson, students relate real world situation to investing. They may visit a local business to do this assignment.
Curated OER
Paper Planes
For this unit, 3rd graders investigate one variable to see if they can make a paper plane fly farther. They use scatter plots to establish a possible relationship between variables then use what they have found to make a paper plane to...
Curated OER
Fuel for Thought
Students explore the mathematical concepts used to compare different types of vehicles. They create a print advertisement in which they persuade an audience to purchase a specific vehicle.
Curated OER
Tracking the Wild Ones
Students apply mathematic skills to discover the extent of the concern for endangered species. Students analyze graphs and look for trends in graphed results of endangered species on a global level.
Curated OER
Getting A Grip On Graphs
Fourth graders gather variety of data and create a graphs to display the data.
Curated OER
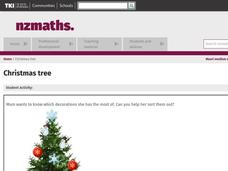
Christmas Tree
Ask the students for ideas on sorting the decorations so that they could tell someone what was in the box. Students share idea for sorting a box of Christmas decorations so that they could tell someone what was in the box. They share...
Curated OER
Fraction Dominoes
Fourth graders participate in a math game that involves practicing their equivalent fraction skills in the advanced multiplication stage seven. They assess their ability skills of equivalent fractions to match twenty seven dominoes on...
Curated OER
Suicides And Suicide Rates
Students investigate suicide using a variety of criteria and create a bar graph before discussing the results as a class.
Curated OER
Happy Birthday Mathematicians and Me
Middle schoolers choose a mathematician or scientist born on the same day as the student and research them. They create a cube or tetrahedron and place required information on the sides (such as birth year, death yr., greatest...


