Concord Consortium
Line of Sight
There's no way around it—learners must use trigonometry to model the line of sight around a race track! Using the starting line as the origin, pupils model the straight line distance to any car using a trigonometric expression. The...
Curated OER
Unit VII Energy: WS 1 Qualitative Analysis - Pie Charts
For each of eight diagrams of objects in motion, physics masters draw pie charts to depict the changes in energy. For each they must identify the energy conditions at each position. This is a unique worksheet, perfect for assessing how...
Curated OER
Scientists Track the Rising Tide
In this tracking the rising tide activity, learners use the data in a graph showing the seal level change versus time from 1900 to 2000 to answer 3 questions about the rising tides. Students determine the slope of a line drawn from 1920...
Curated OER
Basic Algebra and Graphing for Electric Circuits
In this electronics worksheet, students evaluate mathematical expressions to complete 16 short answer and problem solving questions.
Curated OER
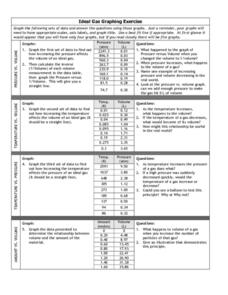
Graphing Exercise of Ideal Gas Data
In this graphing of Ideal Gas Data worksheet, learners use the given data to draw 4 graphs of the given data. They are given the pressure and volume to draw and interpret the graphs.
Curated OER
Gears 2
In this gears instructional activity, students use a ruler and gears to conduct an experiment. Students follow 11 sets of directions,write a conclusion, and graph their results.
Curated OER
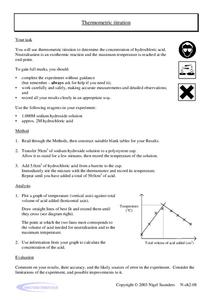
Thermometric Titration
In this thermometric titration worksheet, students titrate hydrochloric acid with sodium hydroxide to determine the concentration of hydrochloric acid. They measure the change in temperature of the solution, plot their data and use the...
WK Kellogg Biological Station
Plotting Phenology
Finally, a worksheet that involves more than filling in some blanks. Your budding ecologists must graph and analyze three sets of data, then synthesize the information as they think about the impacts of plant reproduction on insects and...
Curated OER
A Simple Thermoetric Titration
In this thermometric titration worksheet, high schoolers investigate the changes in temperature when an alkali is neutralized by an acid. Students graph their results from the titration and draw 2 best fit lines on their graph. Where the...
Curated OER
Trends in the Periodic Table
For this trends in the periodic table worksheet, high schoolers plot the ionization energy vs. atomic number and they plot atomic radius vs. atomic number of the first 20 elements. Students analyze their graphs and answer questions about...
Curated OER
Density of Pennies Lab
In this density of pennies worksheet, student conduct an experiment to determine the metals used in the core of pennies made after 1983. Learners design their own experiments using a balance and graph paper to determine the density of...
Curated OER
The Big Bang-Hubble's Law
In this Hubble's law worksheet, students use data for galaxies which include their distance and speed. Students make a graph to show the distance to each galaxy and the speed of each galaxy. They use their graph to answer 4 questions...
Curated OER
Super-Ball Physics
Students experiment with varied balls to determine the bounce factor in centimeters. In this physics instructional activity, students experiment to find the height a ball must be dropped from the have the highest bounce rate. Students...
Curated OER
Describing the Motion of a Battery Powered Cars
Students explore distance a toy car travels by changing the amount of batteries used to power the toy car. In this force and motion lesson, students calculate the average speed of a car while investigating the power from various amounts...
Curated OER
Creating The Blueprints
Students engage in a lesson in order to create blueprints to design an original floorplan. They use graphing paper and drawing tools to demonstrate knowledge of the lesson objectives. Students label and use the right kind of proportions...
Curated OER
Calculating Speed
Fourth graders complete an experiment on calculating speed. In this speed calculation lesson students complete an activity in which they have dominoes fall as slow as possible.
Curated OER
Dude, Who Hit My Car?
Students discuss how investigators solve a hit and run accident. In this physical science lesson, students recreate an accident scene using CEENBot. They collect data from the experiment and formulate conclusion.
Curated OER
Springs 2
In this springs learning exercise, students use paper clips, rubber bands, weights, and more to make springs. Students follow 6 directions, put answers in a chart, and complete 1 question on their own.


