Georgia Department of Education
Math Class
Young analysts use real (provided) data from a class's test scores to practice using statistical tools. Not only do learners calculate measures of center and spread (including mean, median, deviation, and IQ range), but...
American Statistical Association
An A-MAZE-ING Comparison
Teach your class how to use descriptive statistics through a hands-on data collection activity. Pupils collect their own data, calculate test statistics, and interpret the results in context. They compare male and female results, looking...
Statistics Education Web
Using Dice to Introduce Sampling Distributions
Investigate the meaning of a sample proportion using this hands-on activity. Scholars collect data and realize that the larger the sample size the more closely the data resembles a normal distribution. They compare the sample proportion...
Statistics Education Web
Walk the Line
How confident are you? Explore the meaning of a confidence interval using class collected data. Learners analyze data and follow the steps to determine a 95 percent confidence interval. They then interpret the meaning of the confidence...
Statistics Education Web
It’s Elemental! Sampling from the Periodic Table
How random is random? Demonstrate the different random sampling methods using a hands-on activity. Pupils use various sampling techniques to choose a random sample of elements from the periodic table. They use the different samples to...
Statistics Education Web
10,000 Steps?
Conduct an experiment to determine the accuracy of pedometers versus pedometer apps. Class members collect data from each device, analyze the data using a hypothesis test, and determine if there is a significant difference...
Statistics Education Web
Population Parameter with M-and-M's
Manufacturers' claims may or may not be accurate, so proceed with caution. Here pupils use statistics to investigate the M&M's company's claim about the percentage of each color of candy in their packaging. Through the activity,...
Discovery Education
Sonar & Echolocation
A well-designed, comprehensive, and attractive slide show supports direct instruction on how sonar and echolocation work. Contained within the slides are links to interactive websites and instructions for using apps on a mobile device to...
Curated OER
Peer and Self-evaluation in Spoken Tests: Tools and Methods
Students, in groups, each take a different role and are to either ask or answer questions. They explore how to effectively evaluate themselves and others.
Curated OER
Algebra: Reaching New Heights
Students work in pairs to measure their arm span and height and record them on a class chart. The class works together to create a scattergram to display the data. Class discussion focuses on interpreting the scattergram.
Curated OER
Energy, Work and Power
In this energy, work and power worksheet, students solve 12 problems about circuits, electric motors, Ohm's Law and electric currents.
Curated OER
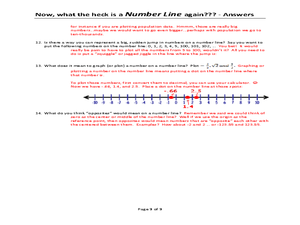
Now, what the heck is a NUMBER LINE again???
A unique approach to reviewing number lines and how to locate different values on them, this worksheet poses several questions that require written answers rather than calculations. You could use this as a note-taking guide when teaching...
Curated OER
Number Sense and Operations
In this number sense and operations worksheet, students solve 15 different problems that include number lines and identifying various types of numbers. First, they solve a given equation and then check their work. Then, students find the...
Curated OER
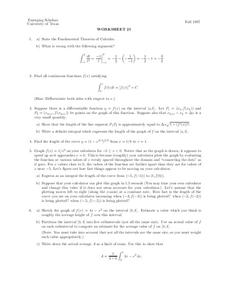
Worksheet 25
In this math worksheet, students state the Fundamental Theorem of Calculus. Then they evaluate the functions and test them against the theorem.
Curated OER
Exploring Area/Perimeter Through Coordinate Geometry
Students explore area and perimeter through coordinate geometry using student literature, hands-on manipulatives, and the Internet.
Khan Academy
Khan Academy: Creating Dot Plots
Practice creating dot plots. Dot plots are very similar to frequency tables, but they make it easier to see the data. Students receive immediate feedback and have the opportunity to try questions repeatedly, watch a video or receive hints.
Quia
Ixl Learning: Dot Plots
Brush up on your math skills relating to dot plots then try some practice problems to test your understanding.
Khan Academy
Khan Academy: Reading Dot Plots & Frequency Tables
Practice reading basic dot plots and frequency tables. Students receive immediate feedback and have the opportunity to try questions repeatedly, watch a video or receive hints.
Khan Academy
Khan Academy: Dot Plots and Frequency Tables Review
Dot plots and frequency tables are tools for displaying data in a more organized fashion. In this article, we review how to make dot plots and frequency tables.
Khan Academy
Khan Academy: Make Line Plots
Practice creating line plots (dot plots) from data sets. Students receive immediate feedback and have the opportunity to try questions repeatedly, watch a tutorial video, or receive hints.
Other
Online Statistics Education: Graphing Distributions [Pdf]
This is the second chapter of a statistics e-text developed collaboratively by Rice University, University of Houston Clear Lake, and Tufts University. It looks at many different types of data displays and the advantages and...
Khan Academy
Khan Academy: Graph Data on Line Plots
Record measurements on line plots (also called dot plots). Students receive immediate feedback and have the opportunity to try questions repeatedly, watch a video or receive hints.
Khan Academy
Khan Academy: Comparing Data Displays
Practice interpreting and comparing dot plots, histograms, and box plots. Students receive immediate feedback and have the opportunity to try questions repeatedly, watch a video or receive hints.


