Curated OER
All Those Advertising Dollars!
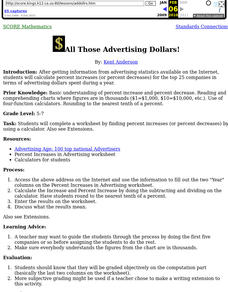
Students calculate percent increases (or percent decreases) for the top 25 companies in terms of advertising dollars spent during a year.
Curated OER
Misconceptions in Mathematics
In this misconceptions worksheet, 6th graders solve and complete 3 different steps in a problem. First, they solve by multiplying the fraction of a number to get the percentage. Then, students find the square roots of both sides of a...
Curated OER
Weaving Heritage Through the Strands of Mountain Windsong
Tenth graders read a novel and then bring in their own artifact with a written description. They also are given a strand to read from certain historical pieces.
Curated OER
Piece of the Sky: Introduction for Making S'COOL Observations
Students observe and discuss cloud cover. They identify percent of cloud cover, calculate cloud cover by fraction and convert to a percent, and compare their models with the current real sky cloud cover.
Curated OER
Planet X
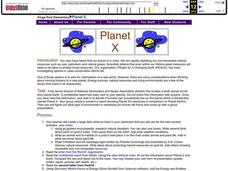
Learners select a wide variety of presentation methods to compare Planet X and Earth. Students share these with their classmates. Learners select other methods to present their ideas about a livable planet for human life forms. ...
Curated OER
Sorting Pennies, A Wagering Activity for Algebra I
Students solve weight equations. In this equations lesson, groups of students weigh and separate pennies to find information necessary to solve simultaneous equations. The teacher provides equations based on the weight of pennies before...
Curated OER
Meatiest States: Graph Problem Solving
In this graph problem solving worksheet, students analyze a graph that shows commercial red meat production in five states. Students answer 5 word problems using the data on the graph.


