Curated OER
Earthquake on the Playground
Students investigate earthquakes by examining chart data. In this disasters lesson, students identify the waves that are recorded when an earthquake arises by reading sample graphs in class. Students participate in an earthquake...
Curated OER
Motion
In this motion activity, students use a position vs. time graph to determine the distance traveled and the velocity at with the object traveled. This activity has 2 problems to solve.
CK-12 Foundation
See Saw
Can a mother who weighs five times more than her child really be held in the air on a see saw by the child? A simple simulation demonstrates how this is possible through altering the distance from the fulcrum. Scholars can adjust the...
National Wildlife Federation
Wind Power
Many have played with seed helicopters at one time or another. Learners use paper to create their own helicopters to model the Linden seed. After a discussion of seed dispersal, they take their models outside, let them go, and make...
Curated OER
I'm Inclined to See; Physics, Math, Science, Experiments, Graphs
High schoolers discover the motion of a sphere on an inclined plane and discover basic relationships involving distance, time, speed(velocity), and acceleration.
Curated OER
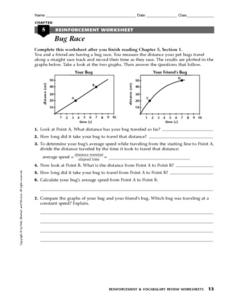
Bug Race
In this motion worksheet, students compare two graphs showing a bug's distance traveled over time. Students calculate the average speed of the bugs and determine which bug was traveling at a constant speed. This worksheet has 1 short...
Curated OER
Graphing Your Motion
Seventh graders investigate velocity and speed. In this Vernier Probe lesson, 7th graders will use probes to calculate motion, speed, and velocity of an object. They will create a graph of their collected data.
Curated OER
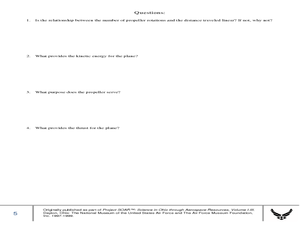
Propellers, Forces and Energy
Students construct a model airplane, measure distance, and calculate velocity. For this creative lesson students work in groups to build a model and use it to calculate distances and velocity.
Curated OER
Don't Crack Humpty
Students investigate the engineering design process and the relationship between distance, time, and speed. Using a generic car base, small groups design a device that will protect an egg on or in the car as it is rolled down a ramp at...
Curated OER
Vectors: How Much Force Can You Apply
This lesson entails the viewing of two videos to get an overview of force and its application. The lesson covers how vectors use force in real-world situations.
Curated OER
Determining Epicenter Distance
In this earthquake worksheet, students determine the distance of the epicenter based on the S-waves and P-waves on a seismograph. This worksheet has 4 problems to solve.
Curated OER
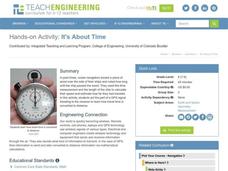
It's About Time
Middle schoolers investigate how Global Positioning Systems work and how and why GPS receivers make errors. They graph data points and apply estimation and prediction to real-life GPS situations, discuss time delay, and complete a...
Curated OER
Hang Time
Students use the equation to calculate the vertical distance an object fall during 1 second in 1/10 second increments. (The acceleration due to gravity on the Earth=a= 9.8 m/s2) Using a graphing calculator, students plot the path of a...
Curated OER
Time and Rate
In this rate graphing worksheet, students graph four examples of rate vs. time. Then students complete 20 short answer questions.
Curated OER
Energy and Work: Transformation Through Engines
Students conduct a webquest on an energy source they chose. In this physics lesson, students design an experiment to determine the factors affecting potential and kinetic energy. They calculate speed and create distance vs. time graphs.
National Council of Teachers of Mathematics
Varying Motion
For this secondary mathematics learning exercise, high schoolers collect data based on a person’s motion. From this data, learners create graphs comparing displacement, velocity, and acceleration to time. The five-page learning exercise...
Curated OER
Describing the Motion of a Battery Powered Cars
Middle schoolers explore distance a toy car travels by changing the amount of batteries used to power the toy car. In this force and motion lesson, students calculate the average speed of a car while investigating the power from various...
Curated OER
Find the Speed of a Protist
Students identify protists under a microscope, and using a stopwatch calculate the speed of a protist from a pond water sample. They use distance and time to identify the speed of a protist, and create a distance versus time graph to...
Curated OER
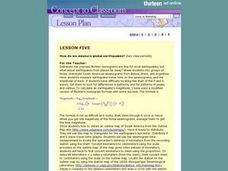
How do we measure global earthquakes?
Learners examine three seismograms of a recent South American earthquake recorded by USGS stations. They measure the S-P distance and use a P and S wave travel-time graph to find the epicenter distance for each seismogram. In addition,...
Curated OER
Investigating Motion, Forces, and Energy Lab Book
Eighth graders create their own experiements using toy trucks, cars or balls to measure the time it takes two of them to travel 5 meters, as well as at each 1 meter interval. They make use computers to make a time/distance graph and...
Curated OER
You Drive Me crazy
Students calculate the distance and acceleration of an object. In this algebra lesson, students collect data and create table and graphs to analyze it. They complete a lab as they collect and analyze data on acceleration and distance.
Curated OER
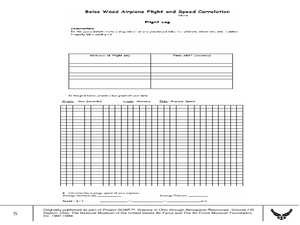
Balsa Wood Airplane Flight and Speed Correlation
Ninth graders calculate the average speed of their balsa wood airplane. In this physics lesson, 9th graders build their own airplane and make necessary modifications to to make it fly straight. They interpret distance and time graph...
Curated OER
Squid Races
Students imitate squid propulsion using a balloon and experience Newton's third law: for every action there is an equal and opposite reaction. Various anatomical designs are tested and analyzed. They calculate the speed of each squid...
Alabama Learning Exchange
Jump! An Exploration into Parametric Equations
Explore parametric equations in this lesson, and learn how to determine how much time it takes for an object to fall compared with an object being launched. high scoolers will use parametric equations to follow the path of objects in...


