Curated OER
Busted Bubbles
Using the scientific method, and bubble gum, learners conduct a motivating experiment. After conducting a series of tests involving bubble gum, they graph and analyze their results. This is the type of activity everyone loves.
Curated OER
Now That's Using Your Head!
Explore linear measurement. Scholars will measure the circumference of their head and the distance they can jump. Information is recorded, averages are calculated, and a data table is completed. They then determine possible relationships...
Curated OER
Graphing Speed; Slope
In this graphing speed learning exercise, students find the slope in a position vs. time graph to be the speed. They are given example graphs of position vs. time to show the changes in slope reflect the changes in speed. Students match...
Curated OER
"Graphing Your Motion"
Students study the concepts of motion, velocity, and acceleration through graphing their own movement using LoggerPro. They explain the difference between speed and velocity using the weather vane example. They discover the difference...
Curated OER
Graphing Your Motion with Vernier LabQuests
Seventh graders create motion graphs using a motion sensor. In this physics lesson, 7th graders match the graph shown by moving their body. They relate the slope to the way they moved.
Messenger Education
My Angle on Cooling—Effect of Distance and Inclination
When exploring Mars, spacecrafts are exposed to 5-11 times more sunlight than when near Earth. Groups of pupils complete a hands-on activity to explore how distance and angle of the sun affect temperature. Through discussions, they then...
Curated OER
Linear Motion 3
In this linear motion activity, students answer 11 questions including finding acceleration of moving objects, finding the distance objects travel and finding the time it takes objects to move a particular distance. Students interpret...
Curated OER
Motion Graphs
In this motion graphs worksheet, high schoolers learn about how motion of objects can be described using a graph. Students then answer 10 fill in the blank, 10 short answer, and 5 problems to solve.
Curated OER
Cool Cars
Students travel one at a time in a straight-line path and attempt to maintain a constant velocity. While one student walks, jogs, or runs, the other group members time the "runner" while standing at five-meter intervals along the path....
Consortium for Ocean Leadership
Nannofossils Reveal Seafloor Spreading Truth
Spread the word about seafloor spreading! Junior geologists prove Albert Wegener right in an activity that combines data analysis and deep ocean exploration. Learners analyze and graph fossil sample data taken from sites along the...
Curated OER
Velocity vs. Time
Twelfth graders read and interpret v-t graphs. After studying velocity and time, 12th graders read graphs to calculate the acceleration of a moving body and determine the distance and displacement of a body. Students explore the...
Curated OER
Olympic Line Graphs
Sixth graders examine how to make line graphs. In this Olympic line graph lesson students make line graphs and search the given Internet sites to find data on their summer Olympic Game.
Curated OER
Match Me!
Young learners explore motion graphs in this instructional activity. They investigate distance-time plots as they move in a specific way in front of the CBR in an attempt to make a motion plot that matches a given plot. Pupils explore...
Curated OER
The Hudson's Ups and Downs
Even rivers have tides. Older elementary schoolers will discuss the Hudson River and how weather, water craft, and the ocean cause tidal fluctuation. They will examine a series of line graphs that depict tidal fluctuation, then analyze...
Curated OER
Which Way?
Middle schoolers explore distance-time plots. In this algebra lesson, they will investigate how different types of motion affect the distance-time plot.
Curated OER
Calculating & Graphing Using a Spreadsheet
Students use the lab apparatus to calculate the average velocity and average acceleration at several points and record the data. They use the spreadsheets to plot distance vs. time, velocity vs. time and acceleration vs. time graphs.
Curated OER
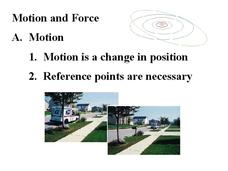
Motion and Force
All the main concepts in motion and force are covered in this presentation. Each slide is a great summary and will appeal to your students with a clean design and images that should seem relevant. Definitions of speed, displacement,...
DiscoverE
LIDAR: Mapping with Lasers
We would be lost without maps! How are they made? Introduce junior topographers to LIDAR technology with a fascinating activity. Set up a mock city, then have learners operate a laser measure to determine the shape of the landscape using...
Curated OER
What's Your Speed?
Learners explore the concept of distance v. time. They use a CBR to collect data on their distance over time, then plot their data using a scatter plot and find an equation to model their data. Pupils discuss what if scenarios which...
Curated OER
Linear Motion 5
For this linear motion worksheet, students answer 9 questions about velocity, acceleration and position of objects. They solve problems for acceleration and velocity and they interpret graphs of velocity vs. time, acceleration vs. time...
Curated OER
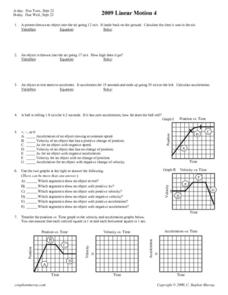
Linear Motion 4
For this linear motion worksheet, students answer 12 questions including finding acceleration of moving objects, calculating distance objects travel and determining the time of travel. Students interpret graphs of position vs. time,...
Curated OER
Measuring & Graphing Motion
Fifth graders study how to measure distance. In this graphing motion lesson students complete a lab activity that shows them on the computer how to make graphs.
Curated OER
Power in the Tubes
Eighth graders investigate the relationship between force, distance and time. In this physical science lesson students compute the work done, graph and find the relationship between work and power.
Mr. E. Science
Motion
An informative presentation covers motion, metric system, conversions, graphing of coordinates and lines, speed, velocity, and acceleration problems, as well as mean calculations. This is the first lesson in a 26-part series.


