Texas Education Agency
Texas Gateway: Data Organization
Given field and laboratory scenarios and laboratory data, students will construct data tables and graphs, using repeated trials and means to organize data.
E-learning for Kids
E Learning for Kids: Math: Rice Field: Data and Length
On this interactive website students practice various math skills using a real life scenario of a rice field. Those skills include understanding information displayed in column graphs, collecting data to answer a question, and measuring...
University of Georgia
University of Georgia: Inter Math: Types of Data
This site has a concise definition of "Data," plus examples of data types and collection methods.
CK-12 Foundation
Ck 12: Interactive Geometry: 11.4 Two Way Frequency Tables
With two pieces of data, learn how to organize the data into a two-way frequency table.
Khan Academy
Khan Academy: Interpreting Two Way Tables
Do you understand how two-way tables really work? Here's your chance to practice. Students receive immediate feedback and have the opportunity to try questions repeatedly, watch a video, or receive hints.
Better Lesson
Better Lesson: Building and Reading Tables With Three Digit Numbers
Second graders gain fluency in reading and building tables using three-digit numbers. This lesson includes a detailed plan, printable worksheets, a video showing students engaged in the lesson, and an exit ticket to assess understanding.
Web Elements
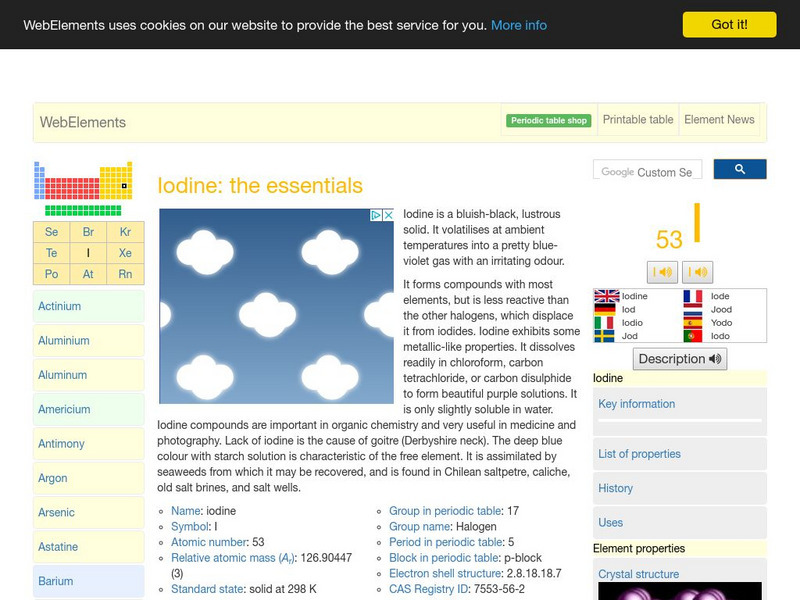
Web Elements Periodic Table: Iodine
A very nice WebElements site with all sorts of basic data on iodine, its chemical and physical properties, isotopes and uses.
Web Elements
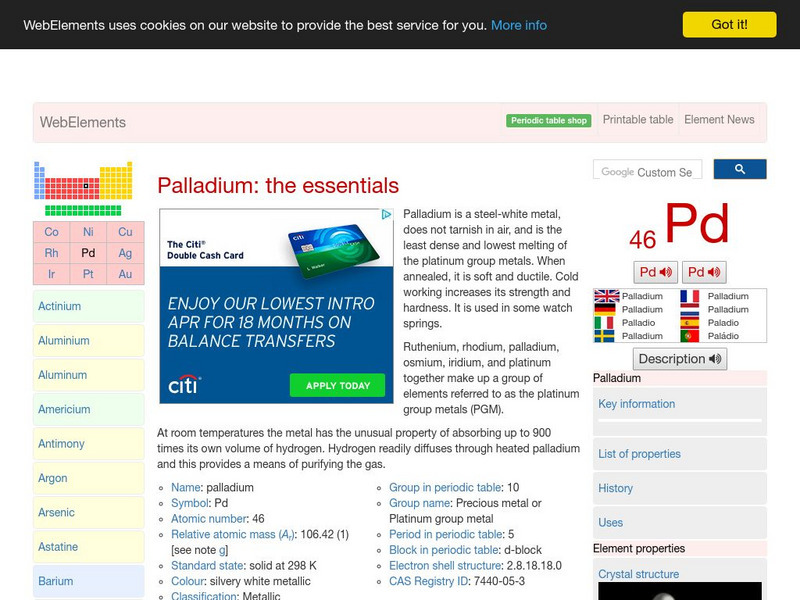
Web Elements Periodic Table: Palladium
WebElements offers a good basic summary of data and descriptive information on palladium, along with a summary of how it is isolated.
Khan Academy
Khan Academy: Two Way Tables Review
Two-way tables organize data based on two categorical variables.
Khan Academy
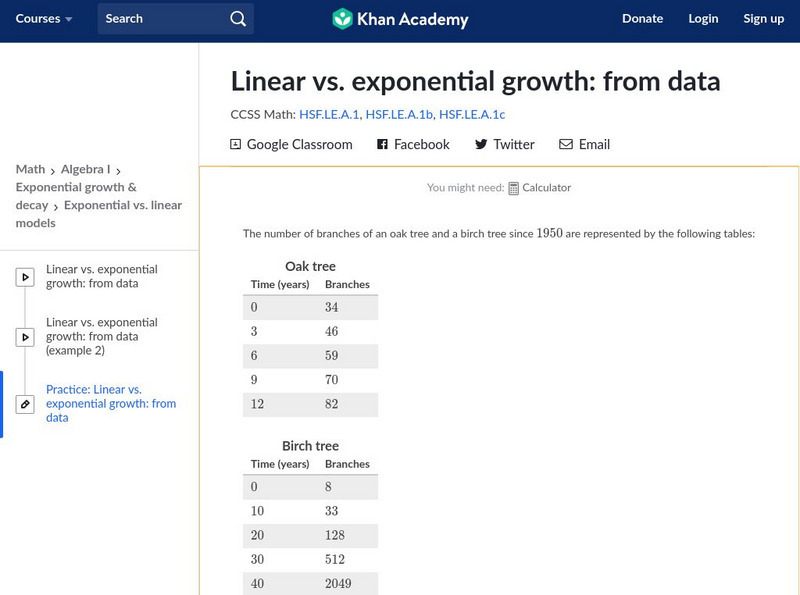
Khan Academy: Algebra I: Linear vs. Exponential Growth: From Data
Given a table with values of two quantities over time, determine whether the quantities grow linearly or exponentially. Students receive immediate feedback and have the opportunity to try questions repeatedly, watch a video or receive...
Better Lesson
Better Lesson: Class Surveys and Graphs
Students love graphing data that they "own". In this plan, the class will select a type of graph and create it using a class survey frequency table. Included in this instructional activity are videos of the class engaged in the...
National Council of Teachers of Mathematics
Nctm: Illuminations: Histogram Tool
This tool can be used to create a histogram for analyzing the distribution of a data set using data that you enter or using pre-loaded data that you select.
National Center for Ecological Analysis and Synthesis, University of California Santa Barbara
Nceas: What Are Data?
This site from NCEAS answers many questions about data. You can also learn about data, tables, and types of graphs in this informative site.
Alabama Learning Exchange
Alex: Great Golly Graphs
This lesson plan asks students to create a survey project including graphs, questions, tables, and data analysis. It gives an assessment and ideas for remediation and extension as well as ways to manage behavior problems and reluctant...
Web Elements
Web Elements Periodic Table: Iron
Lots of data and information on iron, its uses and chemical and physical properties. This WebElements site is an excellent resource.
Web Elements
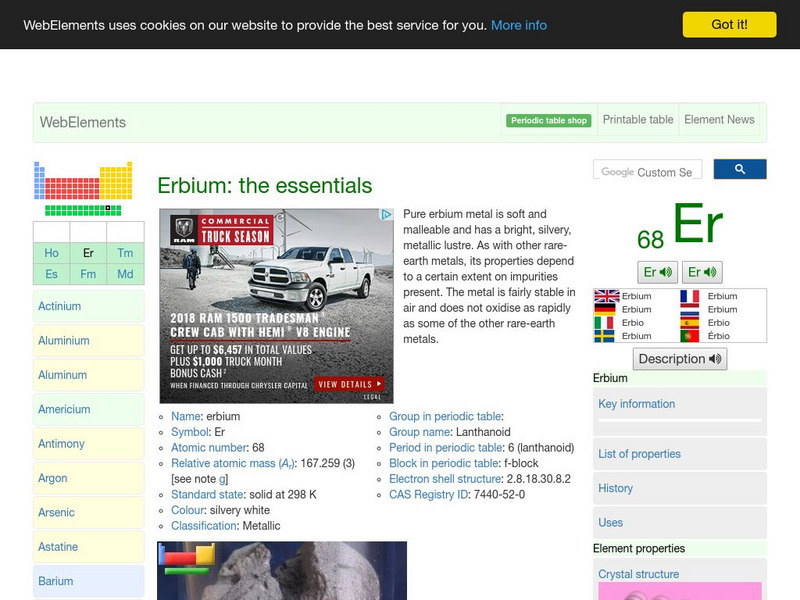
Web Elements Periodic Table: Erbium
Webelements offers a nice presentation on erbium, its properties, uses and history, along with basic data. Clearly presented.
US Census Bureau
U.s. Census Bureau: 2014 Public Elementary Secondary Education Finance Data
This site has statistics on public education finance.
University of Texas at Austin
Mathematics Teks Toolkit: And We Go Around
Collect and display data using a bar and circle graph to explore fractions and percents.
Illustrative Mathematics
Illustrative Mathematics: F Le in the Billions and Linear Modeling
In this task, students are shown a table of world population data and asked to explore whether linear functions would be appropriate to model relationships within the data. Aligns with F-LE.A.1.b.
Cuemath
Cuemath: Bar Graphs
A comprehensive guide for learning all about bar graphs with definitions, solved examples, and practice questions.
Cuemath
Cuemath: Line Graphs
A comprehensive guide for learning all about line graphs with definitions, their sections, how to read and create graphs, solved examples, and practice questions.
Florida-Spectrum Environmental Services
Florida Spectrum: Chemical Fact Sheet: Antimony
Very thorough assembalage of data on antimony, its properties, uses and sources. Detailed.
Florida-Spectrum Environmental Services
Florida Spectrum: Chemical Fact Sheet: Erbium
This site provides a fact sheet with information on the basic data and properties of Erbium. It also includes some of its uses.
Florida-Spectrum Environmental Services
Florida Spectrum: Chemical Fact Sheet: Francium
This site provides a fact sheet with information on the basic data and properties of Francium. It also includes some of its uses.

